
1. Moving the Markets
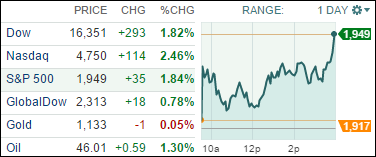
A tech rally today helped Wall Street stage a rebound that sent the Dow up almost 300 points and pushed the Nasdaq back into positive territory for the year. The rally was broad-based as all ten of the S&P 500 sectors rose with technology and industrials leading the way.
Investors were encouraged by several positive economic reports released Wednesday that provided evidence that the U.S. economy continues to churn along despite fears of an economic slowdown in China. Businesses added 190,000 jobs in August, according to payroll processor ADP. The private sector survey provided a preview of Friday’s government employment report on public and private employers, which is predicted to show gains of 218,000 jobs.
Those bullish on retail stocks and consumer spending will be keeping an eye on the shopping numbers that come in during the upcoming Labor Day holiday. While the biggest sales across the board usually come in on Black Friday, Labor Day has proven to be a time for big spending for shoppers.
Today’s rebound affected our 10 ETFs in the Spotlight positively as all of them shifted into reverse and closed higher. Leading the charge was Consumer Discretionaries (XLY) with +2.11%, while Select Dividend ETF (DVY) lagged with +0.95%.
2. ETFs in the Spotlight
In case you missed the announcement and description of this section, you can read it here again.
It features 10 broadly diversified ETFs from my HighVolume list as posted every Monday. Furthermore, they are screened for the lowest MaxDD% number meaning they have been showing better resistance to temporary sell offs than all others over the past year.
Here are the 10 candidates:
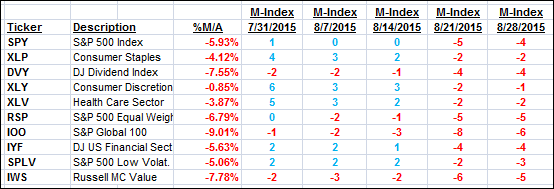
The above table simply demonstrates the magnitude with which some of the ETFs are fluctuating in regards to their positions above or below their respective individual trend lines (%M/A). A break below, represented by a negative number, shows weakness, while a break above, represented by a positive percentage, shows strength.
For hundreds of ETF/Mutual fund choices, be sure to reference Thursday’s StatSheet.
Year to date, here’s how the above candidates have fared so far:
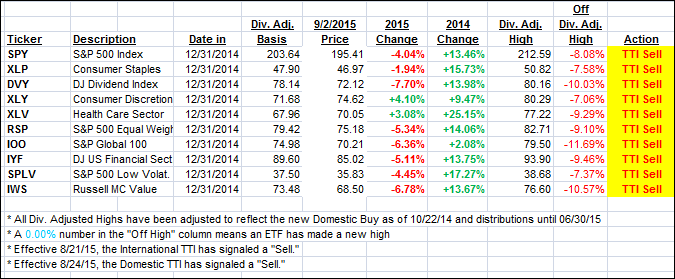
Again, the first table above shows the position of the various ETFs in relation to their respective long term trend lines (%M/A), while the second one tracks their trailing sell stops in the “Off High” column. The “Action” column will signal a “Sell” once the -7.5% point has been taken out in the “Off High” column.
3. Trend Tracking Indexes (TTIs)
Both of our Trend Tracking Indexes (TTIs) improved and headed north but remained entrenched on the bearish side of their respective trend lines:
Here’s how we closed:
Domestic TTI: -2.33% (last close -3.11%)—Sell signal effective 8/24/2015
International TTI: -6.00% (last close -6.99%)—Sell signal effective 8/21/2015
Disclosure: I am obliged to inform you that I, as well as advisory clients of mine, own some of these listed ETFs. Furthermore, they do not represent a specific investment recommendation for you, they merely show which ETFs from the universe I track are falling within the guidelines specified.
Contact Ulli