
1. Moving the Markets
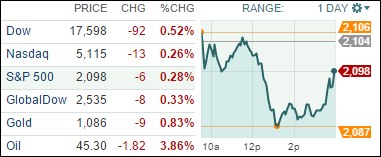
I could have been a lot worse, but the major indexes found some footing late in the day and managed to limit the downside damage with the S&P making up more than half of its intra-day losses. But then again, after last week’s nice gains, a pause was in order.
Weak economic data, such as a poor July manufacturing survey along with very tepid growth for June construction spending, combined with less than expected personal spending (June), took the starch out of any upward momentum. The energy sector led decliners with a 2% loss on the session.
We still remain in the trading range for the S&P with a high of some 2,130 and a low of around 2,050 and, until a breakout occurs, we may be treading water.
Our 10 ETFs in the Spotlight were mixed again with 3 of them gaining and 7 of them losing. Leading the plus side was the S&P 500 Low Volatility ETF (SPLV) with +0.24%; on the minus side, the Mid-Cap Value (IWS) took the dubious honor with -0.45%.
2. ETFs in the Spotlight
In case you missed the announcement and description of this section, you can read it here again.
It features 10 broadly diversified ETFs from my HighVolume list as posted every Monday. Furthermore, they are screened for the lowest MaxDD% number meaning they have been showing better resistance to temporary sell offs than all others over the past year.
Here are the 10 candidates:
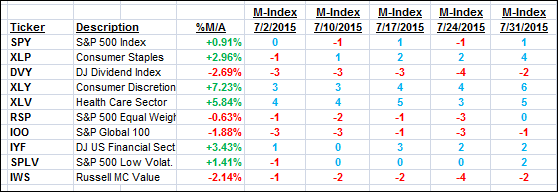
The above table simply demonstrates the magnitude with which some of the ETFs are fluctuating in regards to their positions above or below their respective individual trend lines (%M/A). A break below, represented by a negative number, shows weakness, while a break above, represented by a positive percentage, shows strength.
For hundreds of ETF/Mutual fund choices, be sure to reference Thursday’s StatSheet.
Year to date, here’s how the above candidates have fared so far:
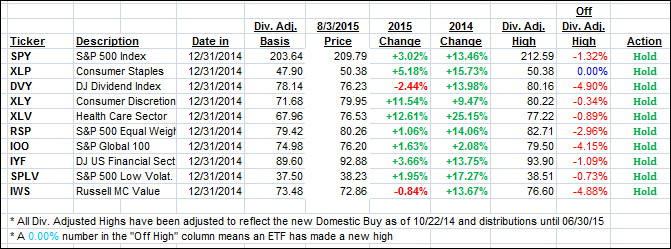
Again, the first table above shows the position of the various ETFs in relation to their respective long term trend lines (%M/A), while the second one tracks their trailing sell stops in the “Off High” column. The “Action” column will signal a “Sell” once the -7.5% point has been taken out in the “Off High” column.
3. Trend Tracking Indexes (TTIs)
Our Trend Tracking Indexes (TTIs) changed only slightly. Take a look:
Domestic TTI: +1.40% (last close +1.47%)—Buy signal effective 10/22/2014
International TTI: +1.22% (last close +1.25%)—Buy signal effective 2/13/2015
Disclosure: I am obliged to inform you that I, as well as advisory clients of mine, own some of these listed ETFs. Furthermore, they do not represent a specific investment recommendation for you, they merely show which ETFs from the universe I track are falling within the guidelines specified.
Contact Ulli