
1. Moving the Markets
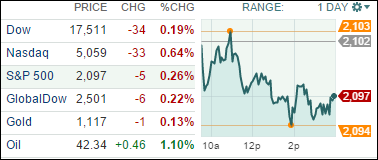
Equities closed lower today after a big earnings miss from Walmart (WMT) and continued concerns over China’s capital markets. All three major indexes here in the U.S. lost and gave back some of Monday’s gains.
Investors were cautious in their trading all day after Walmart reported adjusted quarterly earnings of $1.08, which was four cents short of analyst estimates. The company reduced its outlook for the remainder of the year and shares dropped about 3.4% on the day, which was the biggest loser for the Dow.
Weighing heavily on investors’ minds today was the 6.2% drop in China’s Shanghai Composite index. The index has been extremely volatile as of late, dropping more than 8.5% in a single day just a few weeks ago. The government injected USD $19 billion into the markets to prop up stocks, but investors are weary that this type of intervention may be less supportive of the equity markets moving forward.
The bright spot here at home were home builder stocks. As the real estate rebound continues, investors have remained bullish on housing-related stocks and those have continued to perform. Also, Home Depot (HD) gained 3% after reporting a 5.7% increase in same-store sales.
8 of our 10 ETFs in the Spotlight joined the bears and headed south led by Consumer Staples (XLP) with -0.50%, while Consumer Discretionaries (XLY) bucked the trend and gained +0.09%.
2. ETFs in the Spotlight
In case you missed the announcement and description of this section, you can read it here again.
It features 10 broadly diversified ETFs from my HighVolume list as posted every Monday. Furthermore, they are screened for the lowest MaxDD% number meaning they have been showing better resistance to temporary sell offs than all others over the past year.
Here are the 10 candidates:
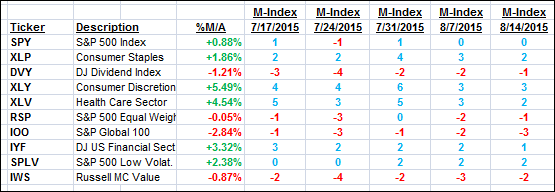
The above table simply demonstrates the magnitude with which some of the ETFs are fluctuating in regards to their positions above or below their respective individual trend lines (%M/A). A break below, represented by a negative number, shows weakness, while a break above, represented by a positive percentage, shows strength.
For hundreds of ETF/Mutual fund choices, be sure to reference Thursday’s StatSheet.
Year to date, here’s how the above candidates have fared so far:
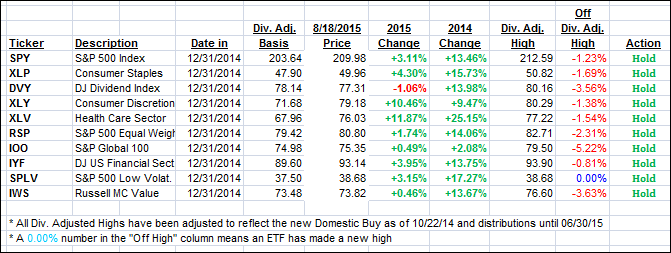
Again, the first table above shows the position of the various ETFs in relation to their respective long term trend lines (%M/A), while the second one tracks their trailing sell stops in the “Off High” column. The “Action” column will signal a “Sell” once the -7.5% point has been taken out in the “Off High” column.
3. Trend Tracking Indexes (TTIs)
Our Trend Tracking Indexes (TTIs) slipped a bit with the International once again dipping slightly below its trend line. Again, I need to see more of a clear and sustained break before calling an end to this Buy cycle:
Domestic TTI: +0.76% (last close +0.93%)—Buy signal effective 10/22/2014
International TTI: -0.26% (last close +0.01%)—Buy signal effective 2/13/2015
Disclosure: I am obliged to inform you that I, as well as advisory clients of mine, own some of these listed ETFs. Furthermore, they do not represent a specific investment recommendation for you, they merely show which ETFs from the universe I track are falling within the guidelines specified.
Contact Ulli