
1. Moving the Markets
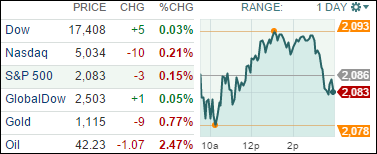
It was another choppy day with the S&P slipping right out of the gates, finding some traction and rallying above the unchanged line but giving back its gains into the close.
The energy sector got spanked again while consumer discretionaries were the bright star today. We’re still stuck as Wall Street finds itself between a rock and hard place trying to shake off China’s devaluation move this week and wondering if the economy is really healthy enough to warrant a rise in interest rates by the Fed.
With no new data scheduled for tomorrow, we may continue to struggle in finding a clear direction.
In the end, it was another mixed day with 3 of our 10 ETFs in the Spotlight gaining and 7 of them retreating. Heading the gainers was Consumer Discretionaries (XLY) with +0.58%, while on the loser’s side Consumer Staples (XLP) fared the worst with -0.40%.
2. ETFs in the Spotlight
In case you missed the announcement and description of this section, you can read it here again.
It features 10 broadly diversified ETFs from my HighVolume list as posted every Monday. Furthermore, they are screened for the lowest MaxDD% number meaning they have been showing better resistance to temporary sell offs than all others over the past year.
Here are the 10 candidates:
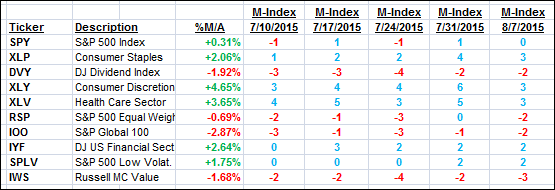
The above table simply demonstrates the magnitude with which some of the ETFs are fluctuating in regards to their positions above or below their respective individual trend lines (%M/A). A break below, represented by a negative number, shows weakness, while a break above, represented by a positive percentage, shows strength.
For hundreds of ETF/Mutual fund choices, be sure to reference Thursday’s StatSheet.
Year to date, here’s how the above candidates have fared so far:
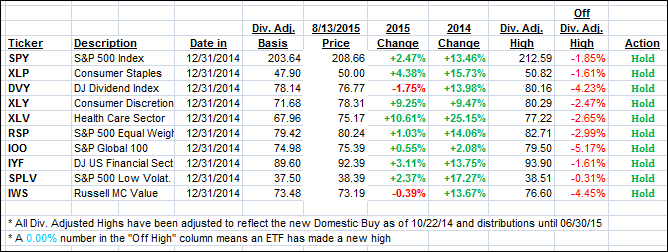
Again, the first table above shows the position of the various ETFs in relation to their respective long term trend lines (%M/A), while the second one tracks their trailing sell stops in the “Off High” column. The “Action” column will signal a “Sell” once the -7.5% point has been taken out in the “Off High” column.
3. Trend Tracking Indexes (TTIs)
Our Trend Tracking Indexes (TTIs) slipped again with the International one now slipping below its trend line; but barely. We need to see more of a piercing to the downside, before I declare the International Buy cycle to be over:
Domestic TTI: +0.54% (last close +0.66%)—Buy signal effective 10/22/2014
International TTI: -0.01% (last Friday +0.16%)—Buy signal effective 2/13/2015
Disclosure: I am obliged to inform you that I, as well as advisory clients of mine, own some of these listed ETFs. Furthermore, they do not represent a specific investment recommendation for you, they merely show which ETFs from the universe I track are falling within the guidelines specified.
Contact Ulli