
1. Moving the Markets
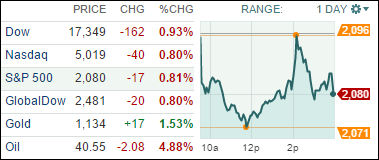
The ticking sounds of the countdown clock to the Fed’s interest rate hike are getting louder it seems. The stock market closed lower today after minutes from the Fed’s last policy meeting showed the central bank was “approaching” its first rate hike in nearly a decade. Rates near 0% and cheap borrowing costs have helped the real estate sector and greater economy heal over the past decade.
However, much of the policy speculation has depended on improvement in the labor markets and inflation moving back to its 2% mandate. The labor market has improved, but inflation remains tame. Consumer price level in July, for example, grew only 0.01%, which was below its forecast. Then there are stumbling oil prices and the devaluation of the Renminbi…
Oil prices have continued to slide, which is deflationary for the USD and China devaluing its currency sent yellow flags up about the state of the world’s second largest economy.
Let’s keep one eye on the domestic housing market indexes as we move towards the end of the week, as well as what the reactions will be on the Fed and China policy over the next couple of trading days. If it any more slippage occurs, we may very well enter bear market territory and exit our equity positions. Please see section 3 below for the current status.
All of our 10 ETFs in the Spotlight headed south today as bearish forces were too strong to overcome. Still, Consumer Discretionaries (XLY) held up the best by surrendering only -0.18%, while the Mid-Cap Value (IWS) fared the worst by giving back -0.93%.
2. ETFs in the Spotlight
In case you missed the announcement and description of this section, you can read it here again.
It features 10 broadly diversified ETFs from my HighVolume list as posted every Monday. Furthermore, they are screened for the lowest MaxDD% number meaning they have been showing better resistance to temporary sell offs than all others over the past year.
Here are the 10 candidates:
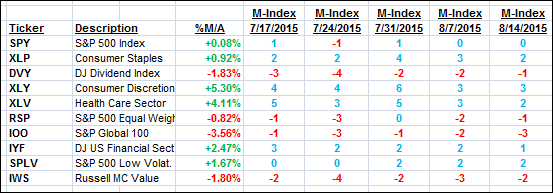
The above table simply demonstrates the magnitude with which some of the ETFs are fluctuating in regards to their positions above or below their respective individual trend lines (%M/A). A break below, represented by a negative number, shows weakness, while a break above, represented by a positive percentage, shows strength.
For hundreds of ETF/Mutual fund choices, be sure to reference Thursday’s StatSheet.
Year to date, here’s how the above candidates have fared so far:
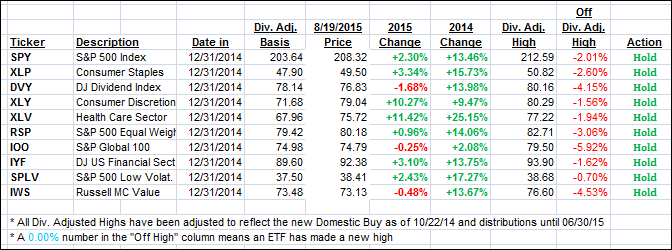
Again, the first table above shows the position of the various ETFs in relation to their respective long term trend lines (%M/A), while the second one tracks their trailing sell stops in the “Off High” column. The “Action” column will signal a “Sell” once the -7.5% point has been taken out in the “Off High” column.
3. Trend Tracking Indexes (TTIs)
Our Trend Tracking Indexes (TTIs) headed south with the International one spiking past the the -1% level below its long term trend line. In order to avoid an immediate whip-saw signal, I will give it another day to see if it remains decisively negative. If so, I will then issue the “Sell” signal for international funds/ETFs.
Here’s how we ended this roller coaster day:
Domestic TTI: +0.47% (last close +0.76%)—Buy signal effective 10/22/2014
International TTI: -1.04% (last close -0.26%)—Buy signal effective 2/13/2015
Disclosure: I am obliged to inform you that I, as well as advisory clients of mine, own some of these listed ETFs. Furthermore, they do not represent a specific investment recommendation for you, they merely show which ETFs from the universe I track are falling within the guidelines specified.
Contact Ulli