
ETF/No Load Fund Tracker StatSheet
————————————————————-
THE LINK TO OUR CURRENT ETF/MUTUAL FUND STATSHEET IS:
————————————————————
Market Commentary
MAJOR INDEXES SLIP DURING VOLATILE WEEK
1. Moving the Markets
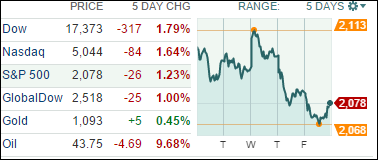
During this volatile week, the Dow managed to head for its longest slide in some 4 years with bio-techs, commodities and oil leading the trend towards bear market territory.
The S&P 500 gave back 1.23% this week and violated its widely followed 200-day moving average to the downside a couple of times but in the end, the index managed to close back above it by +0.51%.
The jobs report came in largely as expected and at a pace the Fed wants to see in order to justify its possible interest rate hike still anticipated for September. The only fly in the ointment was the unfortunate fact that there has only been minimal wage growth, which does not bode well for an economy that is depended on its citizens to spend with utter abandon.
Our 10 ETFs in the Spotlight were mixed again with 2 of them inching up on the day and 8 of them losing. Managing a scant gain were Select Dividends (DVY) and the Financials (IYF) with +0.03% each. On the downside, the worst performer was Consumer Staples with -0.56%.
2. ETFs in the Spotlight
In case you missed the announcement and description of this section, you can read it here again.
It features 10 broadly diversified ETFs from my HighVolume list as posted every Monday. Furthermore, they are screened for the lowest MaxDD% number meaning they have been showing better resistance to temporary sell offs than all others over the past year.
Here are the 10 candidates:
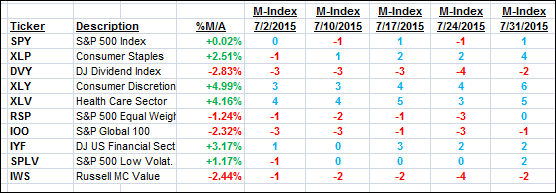
The above table simply demonstrates the magnitude with which some of the ETFs are fluctuating in regards to their positions above or below their respective individual trend lines (%M/A). A break below, represented by a negative number, shows weakness, while a break above, represented by a positive percentage, shows strength.
For hundreds of ETF/Mutual fund choices, be sure to reference Thursday’s StatSheet.
Year to date, here’s how the above candidates have fared so far:
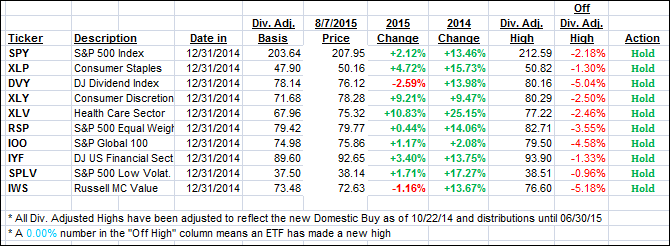
Again, the first table above shows the position of the various ETFs in relation to their respective long term trend lines (%M/A), while the second one tracks their trailing sell stops in the “Off High” column. The “Action” column will signal a “Sell” once the -7.5% point has been taken out in the “Off High” column.
3. Trend Tracking Indexes (TTIs)
Our Trend Tracking Indexes (TTIs) slipped this week but remain on the bullish side of their respective trend lines:
Domestic TTI: +0.62% (last Friday +1.47%)—Buy signal effective 10/22/2014
International TTI: +0.60% (last Friday +1.25%)—Buy signal effective 2/13/2015
Have a nice weekend.
Ulli…
Disclosure: I am obliged to inform you that I, as well as advisory clients of mine, own some of these listed ETFs. Furthermore, they do not represent a specific investment recommendation for you, they merely show which ETFs from the universe I track are falling within the guidelines specified.
————————————————————-
READER Q & A FOR THE WEEK
All Reader Q & A’s are listed at our web site!
Check it out at:
http://www.successful-investment.com/q&a.php
———————————————————-
WOULD YOU LIKE TO HAVE YOUR INVESTMENTS PROFESSIONALLY MANAGED?
Do you have the time to follow our investment plans yourself? If you are a busy professional who would like to have his portfolio managed using our methodology, please contact me directly or get more details at:
https://theetfbully.com/personal-investment-management/
———————————————————
Back issues of the ETF/No Load Fund Tracker are available on the web at:
https://theetfbully.com/newsletter-archives/
Contact Ulli