
1. Moving the Markets
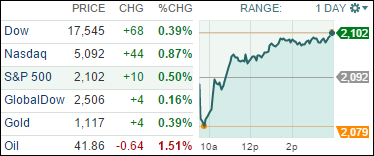
The major indexes overcame an early drop, with the S&P 500 visiting the 2,079 level, at which point the bulls took over and managed to push the index back above the 2,100 mark.
Homebuilders were the leaders, although volume was extremely light with anxiety being present about the intentions of the Fed as to their stance on interest rates. We continue to be stuck in a tight trading range and need some sort of driver to provide new upside momentum.
Concerns about China have eased somewhat so the focus has been on the economy and what the Fed might or might not do. If they decide to become more transparent in their intentions, we most likely will see an immediate market reaction. Should the Fed indicate that a rate hike for September is unlikely, whatever obscure language they might use to come to that conclusion, we could see the top of the trading range (around 2,130 for the S&P 500) being taken out with the next target being the 2,050 level.
All of our 10 ETFs in the Spotlight managed to close up with Healthcare (XLV) taking the lead by gaining +1.01%. Lagging today was Consumer Staples (XLP), which eked out a meager +0.10%.
2. ETFs in the Spotlight
In case you missed the announcement and description of this section, you can read it here again.
It features 10 broadly diversified ETFs from my HighVolume list as posted every Monday. Furthermore, they are screened for the lowest MaxDD% number meaning they have been showing better resistance to temporary sell offs than all others over the past year.
Here are the 10 candidates:
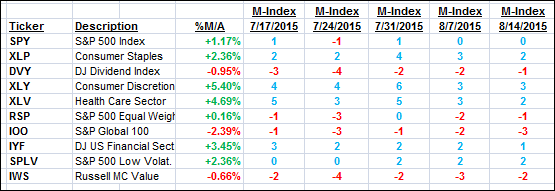
The above table simply demonstrates the magnitude with which some of the ETFs are fluctuating in regards to their positions above or below their respective individual trend lines (%M/A). A break below, represented by a negative number, shows weakness, while a break above, represented by a positive percentage, shows strength.
For hundreds of ETF/Mutual fund choices, be sure to reference Thursday’s StatSheet.
Year to date, here’s how the above candidates have fared so far:
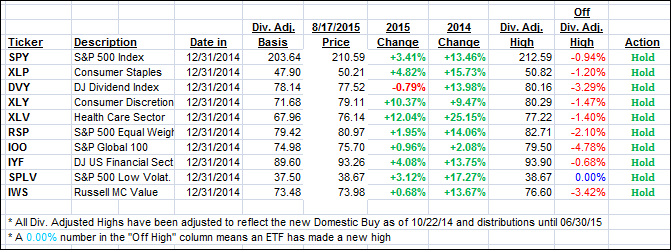
Again, the first table above shows the position of the various ETFs in relation to their respective long term trend lines (%M/A), while the second one tracks their trailing sell stops in the “Off High” column. The “Action” column will signal a “Sell” once the -7.5% point has been taken out in the “Off High” column.
3. Trend Tracking Indexes (TTIs)
Our Trend Tracking Indexes (TTIs) recovered today with the International one crawling back above its long-term trend line—but barely:
Domestic TTI: +0.93% (last close +0.64%)—Buy signal effective 10/22/2014
International TTI: +0.01% (last close -0.16%)—Buy signal effective 2/13/2015
Disclosure: I am obliged to inform you that I, as well as advisory clients of mine, own some of these listed ETFs. Furthermore, they do not represent a specific investment recommendation for you, they merely show which ETFs from the universe I track are falling within the guidelines specified.
Contact Ulli