
1. Moving the Markets
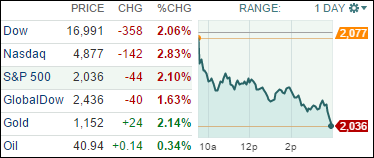
It was a sea of red numbers crashing on world equities as Wall Street notched a third straight day of losses with the Dow plunging 358 points. When the markets closed today, the Dow sat below 17,000 for the first time since Oct. 29 last year.
Fear is still percolating throughout the marketplace due to the losses and negative feel about markets globally. The closely watched Wall Street “fear gauge,” dubbed the VIX, is up nearly 20% today to 18.19, its highest level since July 9, but still well below its 52-week peak of 31.06 back on Oct. 15.
Crude did not perform well today either. A barrel of U.S. based crude flirted with falling below the $40 per barrel mark today for the first time since early 2009, which marks a fresh 6-1/2 year low. Crude is being pressured by data showing a bigger weekly inventory build in the U.S., continued oversupply and concerns about slowing growth in China.
None of our 10 ETFs in the Spotlight were able to overcome the worldwide bearishness, so all closed in the red. Leading to the downside was Healthcare (XLV) with -2.32% with Consumer Staples (XLP) showing the most resistance with a modest loss of -0.91%.
Our Trend Tracking Indexes (TTIs) broke their trend lines to the downside confirming the “Sell” signal for the International one. The Domestic one is in alert mode. Please see section 3 below for details.
2. ETFs in the Spotlight
In case you missed the announcement and description of this section, you can read it here again.
It features 10 broadly diversified ETFs from my HighVolume list as posted every Monday. Furthermore, they are screened for the lowest MaxDD% number meaning they have been showing better resistance to temporary sell offs than all others over the past year.
Here are the 10 candidates:
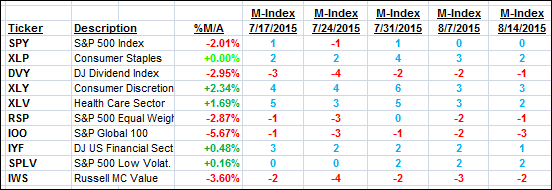
The above table simply demonstrates the magnitude with which some of the ETFs are fluctuating in regards to their positions above or below their respective individual trend lines (%M/A). A break below, represented by a negative number, shows weakness, while a break above, represented by a positive percentage, shows strength.
For hundreds of ETF/Mutual fund choices, be sure to reference Thursday’s StatSheet.
Year to date, here’s how the above candidates have fared so far:
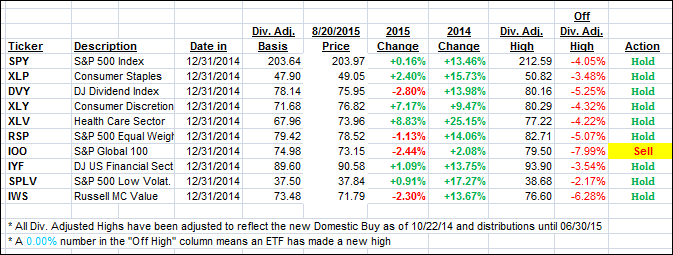
Again, the first table above shows the position of the various ETFs in relation to their respective long term trend lines (%M/A), while the second one tracks their trailing sell stops in the “Off High” column. The “Action” column will signal a “Sell” once the -7.5% point has been taken out in the “Off High” column.
3. Trend Tracking Indexes (TTIs)
Both of our Trend Tracking Indexes (TTIs) closed below their respective trend lines and in bear market territory.
The International TTI confirmed its bearishness from the last couple of days, which means that all “broadly diversified international funds/ETFs” should be sold. The effective date for tracking purposes will be tomorrow, August 21, 2015.
The Domestic TTI broke below its long-term trend line for the first time today but only by a fraction of a percent. Because this was its first move below the line, I will hold off for another day to evaluate if there is rebound in the making in order to avoid a potential whip-saw signal.
However, if more weakness is apparent, and the TTI slips further, I will issue the Domestic “Sell” signal at that time.
Here’s how we ended up:
Domestic TTI: -0.67% (last close +0.47%)—Buy signal effective 10/22/2014
International TTI: -2.85% (last close -1.04%)—Sell signal effective 8/21/2015
Disclosure: I am obliged to inform you that I, as well as advisory clients of mine, own some of these listed ETFs. Furthermore, they do not represent a specific investment recommendation for you, they merely show which ETFs from the universe I track are falling within the guidelines specified.
Contact Ulli