
1. Moving the Markets
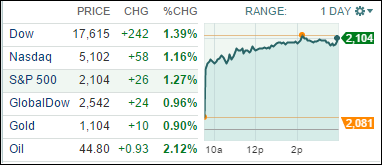
We have all been wondering when the Dow was going to move back into positive territory after a seven day losing streak. Well, today investors had their rally caps on apparently. The Dow jumped 242 points It was the biggest gain for the blue-chip index since May 8. The Dow recouped a large amount of its 378 point loss that it racked up over 7 days in its longest run of losses in four years.
As for the S&P, nine of the ten sectors closed higher. The energy sector took the lead with a 3.1% gain as oil prices rebounded. Benchmark U.S. crude jumped 2% to $44.74 a barrel after falling below $44 on Friday. The energy sector has slumped 16% in the last three months as oil has dropped back toward its low of the year. Utilities were the sole sector in the red.
In the M&A space, Mr. Buffet stole headlines today as news announced he will be closing on the largest deal in Berkshire Hathaway history. Berkshire (BRK.A, BRK.B) said today that it will pay $235 per share in cash for all of Portland based Precision Castparts’ (PCP) shares. That represents a 21% premium on the stock’s Friday closing price of $193.88. The global manufacturer makes castings, forged components, aerostructures and fasteners for the aerospace market. It also produces pipe and fittings for the power business and many other parts. The companies expect the deal to close in the first quarter of 2016.
All of our 10 ETFs in the Spotlight enjoyed today’s rebound and closed up. The leader was Mid-Cap Value (IWS) with +1.54%, while the laggard turned out to be Consumer Staples (XLP) with +0.38%.
2. ETFs in the Spotlight
In case you missed the announcement and description of this section, you can read it here again.
It features 10 broadly diversified ETFs from my HighVolume list as posted every Monday. Furthermore, they are screened for the lowest MaxDD% number meaning they have been showing better resistance to temporary sell offs than all others over the past year.
Here are the 10 candidates:
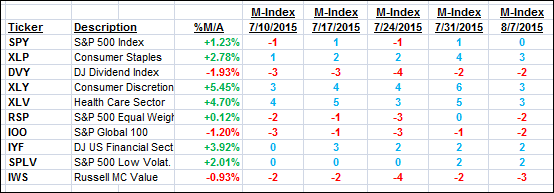
The above table simply demonstrates the magnitude with which some of the ETFs are fluctuating in regards to their positions above or below their respective individual trend lines (%M/A). A break below, represented by a negative number, shows weakness, while a break above, represented by a positive percentage, shows strength.
For hundreds of ETF/Mutual fund choices, be sure to reference Thursday’s StatSheet.
Year to date, here’s how the above candidates have fared so far:
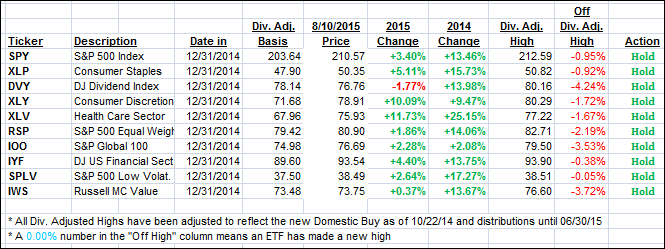
Again, the first table above shows the position of the various ETFs in relation to their respective long term trend lines (%M/A), while the second one tracks their trailing sell stops in the “Off High” column. The “Action” column will signal a “Sell” once the -7.5% point has been taken out in the “Off High” column.
3. Trend Tracking Indexes (TTIs)
Our Trend Tracking Indexes (TTIs) recovered and closed higher:
Domestic TTI: +1.16% (last close +0.62%)—Buy signal effective 10/22/2014
International TTI: +1.48% (last Friday +0.60%)—Buy signal effective 2/13/2015
Disclosure: I am obliged to inform you that I, as well as advisory clients of mine, own some of these listed ETFs. Furthermore, they do not represent a specific investment recommendation for you, they merely show which ETFs from the universe I track are falling within the guidelines specified.
Contact Ulli