
1. Moving the Markets
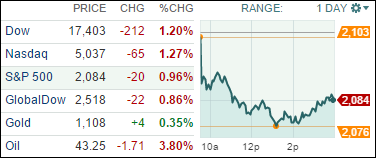
For the time being, today’s pullback makes yesterday’s big advance look like a dead cat bounce. Just as the bulls had taken charge, the rug was pulled out from under them as the Chinese devalued the Yuan sending world markets reeling.
This brought up concerns as to whether the slowdown in China is worse than had been expected. The immediate negative effect was on automakers, commodity producers and other exporters; even Apple dropped 5.2%.
The devaluation was 1.9%, which was the most in a couple of decades. Some of the recent economic numbers out of China showed plunging exports and overall weakness in manufacturing. The big question is: will this now lead to a new round of currency devaluation by others as well and the beginning of trade wars? Only time will tell; but it appears to me that the current market volatility may be with us for a while longer.
In a reversal from yesterday, all of our 10 ETFs in the Spotlight changed direction and headed south as bulls were absent all day. Taking the lead to the downside was the Global 100 (IOO) with -1.19%, while Consumer Staples (XLP) and the Low Volatility S&P (SPLV) held up best by dropping only 0.36% each.
2. ETFs in the Spotlight
In case you missed the announcement and description of this section, you can read it here again.
It features 10 broadly diversified ETFs from my HighVolume list as posted every Monday. Furthermore, they are screened for the lowest MaxDD% number meaning they have been showing better resistance to temporary sell offs than all others over the past year.
Here are the 10 candidates:
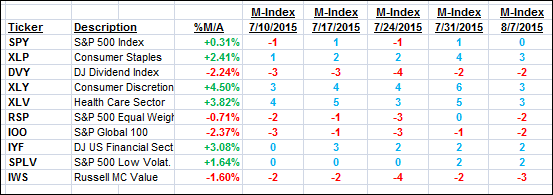
The above table simply demonstrates the magnitude with which some of the ETFs are fluctuating in regards to their positions above or below their respective individual trend lines (%M/A). A break below, represented by a negative number, shows weakness, while a break above, represented by a positive percentage, shows strength.
For hundreds of ETF/Mutual fund choices, be sure to reference Thursday’s StatSheet.
Year to date, here’s how the above candidates have fared so far:
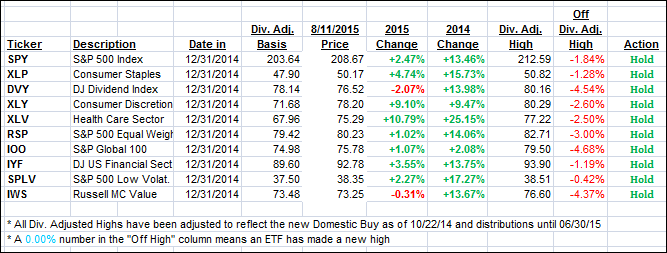
Again, the first table above shows the position of the various ETFs in relation to their respective long term trend lines (%M/A), while the second one tracks their trailing sell stops in the “Off High” column. The “Action” column will signal a “Sell” once the -7.5% point has been taken out in the “Off High” column.
3. Trend Tracking Indexes (TTIs)
Our Trend Tracking Indexes (TTIs) retreated and gave back yesterday’s gains:
Domestic TTI: +0.70% (last close +1.16%)—Buy signal effective 10/22/2014
International TTI: +0.45% (last Friday +1.48%)—Buy signal effective 2/13/2015
Disclosure: I am obliged to inform you that I, as well as advisory clients of mine, own some of these listed ETFs. Furthermore, they do not represent a specific investment recommendation for you, they merely show which ETFs from the universe I track are falling within the guidelines specified.
Contact Ulli