
1. Moving the Markets
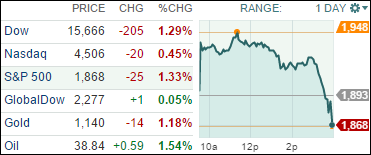
This morning, China’s Shanghai index took another cliff dive at the tune of some 7.6%, but the European and U.S. markets simply ignored it as they were busy celebrating the Tuesday bounce-back, which took the Dow up by some 440 points.
Unfortunately, the euphoric feeling did not last, and the major indexes participated in a last hour selling frenzy that wiped out all morning gains and pulled stocks deeper into bear market territory making this a classic dead cat bounce. Apparently, China did matter.
Over the past 30 years, I have observed that large point gains in the indexes rarely occur in bull markets but are predominantly a sharp reflex response once our domestic TTI has moved into bear market territory. In fact, six of the largest point gains occurred between September 2008 and March 2009. You can read about it here.
At this time I expect continued volatility with large drops being followed by sharp rebounds with bias being to the downside. I hope you took the opportunity this morning to bail out of any equity holdings you had left. Remember, markets tend to go down a lot faster than they go up.
All of our 10 ETFs in the Spotlight headed south again, as the hope rally ran out of steam. Leading the downside was the Select Dividend ETF (DVY) with a loss of -1.84%. Resisting the sell-off best was the Consumer Discretionaries ETF (XLY), which gave back -0.43%.
2. ETFs in the Spotlight
In case you missed the announcement and description of this section, you can read it here again.
It features 10 broadly diversified ETFs from my HighVolume list as posted every Monday. Furthermore, they are screened for the lowest MaxDD% number meaning they have been showing better resistance to temporary sell offs than all others over the past year.
Here are the 10 candidates:
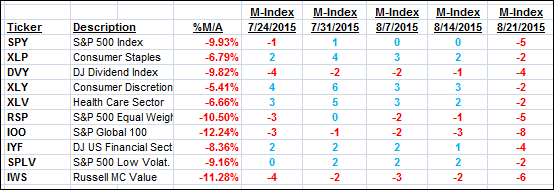
The above table simply demonstrates the magnitude with which some of the ETFs are fluctuating in regards to their positions above or below their respective individual trend lines (%M/A). A break below, represented by a negative number, shows weakness, while a break above, represented by a positive percentage, shows strength.
For hundreds of ETF/Mutual fund choices, be sure to reference Thursday’s StatSheet.
Year to date, here’s how the above candidates have fared so far:
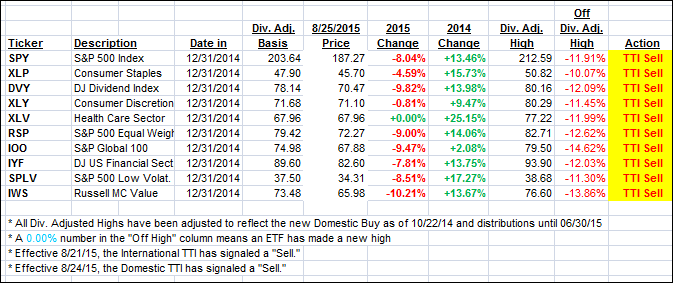
Again, the first table above shows the position of the various ETFs in relation to their respective long term trend lines (%M/A), while the second one tracks their trailing sell stops in the “Off High” column. The “Action” column will signal a “Sell” once the -7.5% point has been taken out in the “Off High” column. Overriding the sell stop will be a break of the Trend Tracking Indexes (TTIs) below their respective trend lines, a condition which we have now reached.
3. Trend Tracking Indexes (TTIs)
Both of our Trend Tracking Indexes (TTIs) were mixed with the Domestic one sliding and the International one improving a tad.
We remain in cash and will evaluate various asset classes to see if there is any bullishness left anywhere.
Here’s how we closed:
Domestic TTI: -4.00% (last close -3.64%)—Sell signal effective 8/24/2015
International TTI: -7.34% (last close -7.83%)—Sell signal effective 8/21/2015
Disclosure: I am obliged to inform you that I, as well as advisory clients of mine, own some of these listed ETFs. Furthermore, they do not represent a specific investment recommendation for you, they merely show which ETFs from the universe I track are falling within the guidelines specified.
Contact Ulli