
1. Moving the Markets
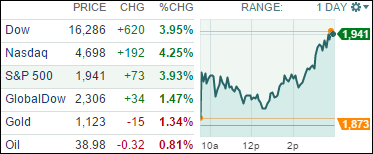
The Dow rebounded big time today, surging nearly 620 points, which is its third-best daily point gain ever and best since 2008. This finally ended a painful six-day losing streak and gave Wall Street the signs of stabilization it has been craving after its worst rout in four years.
Giving the markets a boost early Wednesday was a strong reading on durable goods orders in July, orders for large-ticket items like dishwashers and washing machines. The 2% rise helped boost confidence about the U.S. economy.
While stocks in China ended the volatile trading session lower, the losses were not as dramatic as seen in recent days—only about -1%. Chinese officials took steps to shore up its economy and markets Tuesday by cutting interest rates and taking steps to make it easier for banks to lend money to borrowers.
The big question now remains as to whether this was just another dead cat bounce or a rebound with legs. Of course, nobody has that answer, and it’s way to early to make any assessment of the market, since we just went bearish last Friday. Fast and furious moves are rarely a sign of directional strength; they merely confirm uncertainty and nothing else.
We need to see a slow and steady up-move, maybe some sideways meandering followed by a break of our TTIs to the upside. Then we have something tangible we can work with. Until that break occurs, I consider all moves, up and down, simply part of bear market turmoil.
All of our 10 ETFs in the Spotlight showed some green numbers for a change with all sectors participating in the rebound. The leader was the Low Volatility ETF (SPLV) with +4.87%. Lagging a bit was the Select Dividend ETF (DVY) with +2.17%. See section 3 below for the effect on our Trend Tracking Indexes.
2. ETFs in the Spotlight
In case you missed the announcement and description of this section, you can read it here again.
It features 10 broadly diversified ETFs from my HighVolume list as posted every Monday. Furthermore, they are screened for the lowest MaxDD% number meaning they have been showing better resistance to temporary sell offs than all others over the past year.
Here are the 10 candidates:
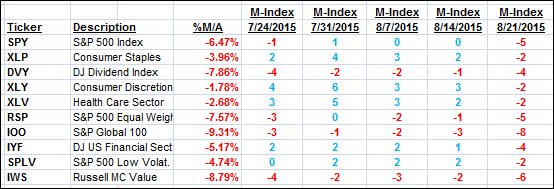
The above table simply demonstrates the magnitude with which some of the ETFs are fluctuating in regards to their positions above or below their respective individual trend lines (%M/A). A break below, represented by a negative number, shows weakness, while a break above, represented by a positive percentage, shows strength.
For hundreds of ETF/Mutual fund choices, be sure to reference Thursday’s StatSheet.
Year to date, here’s how the above candidates have fared so far:
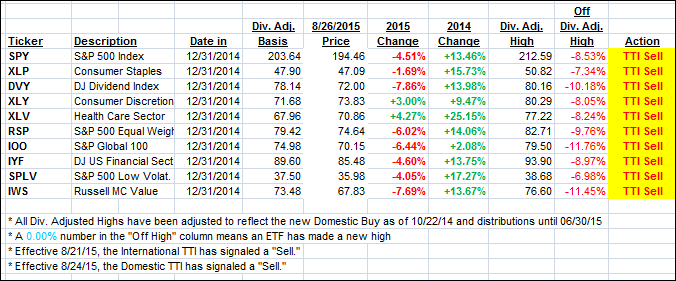
Again, the first table above shows the position of the various ETFs in relation to their respective long term trend lines (%M/A), while the second one tracks their trailing sell stops in the “Off High” column. The “Action” column will signal a “Sell” once the -7.5% point has been taken out in the “Off High” column. Overriding the sell stop will be a break of the Trend Tracking Indexes (TTIs) below their respective trend lines, a condition which we have now reached.
3. Trend Tracking Indexes (TTIs)
Both of our Trend Tracking Indexes (TTIs) improved but remain stuck on the bearish side of their respective trend lines. We closed as follows:
Domestic TTI: -2.45% (last close -4.00%)—Sell signal effective 8/24/2015
International TTI: -5.79% (last close -7.34%)—Sell signal effective 8/21/2015
Disclosure: I am obliged to inform you that I, as well as advisory clients of mine, own some of these listed ETFs. Furthermore, they do not represent a specific investment recommendation for you, they merely show which ETFs from the universe I track are falling within the guidelines specified.
Contact Ulli