
1. Moving the Markets
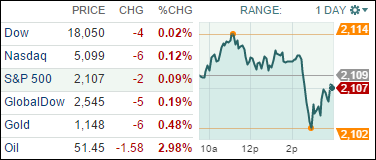
Finally, the 4-day winning streak came to an end, but the losses were minor as a late day turnaround caused by violent Greek protests ahead of their parliamentary votes regarding the third bailout package pulled the rug out from initial upward momentum.
While we bounced successfully off the session’s lows, it remains to be seen if there is more fallout should the outcome of the Greece vote displease the masses.
Earlier in the day, China reported a GDP of 7% vs expectations of 6.9%, which was questioned by various media outlets. Of course, China would never fudge those numbers, but even the Shanghai index, based on its loss of over 3% for the day, seems to have a different view.
It was a tug-of-war today between bulls and bears with every piece of news being dissected carefully. Fed chief Yellen had to endure some tough questioning but is still in support of raising interest rates somewhat later on this year.
8 of our 10 ETFs in the Spotlight eked out small gains during this see-saw session. On the upside, Financials (IYF) led with +0.59%, while the loser of the day was the Mid-Cap Value ETF (IWS), which gave back -0.48%.
2. ETFs in the Spotlight
In case you missed the announcement and description of this section, you can read it here again.
It features 10 broadly diversified ETFs from my HighVolume list as posted every Monday. Furthermore, they are screened for the lowest MaxDD% number meaning they have been showing better resistance to temporary sell offs than all others over the past year.
Here are the 10 candidates:

The above table simply demonstrates the magnitude with which some of the ETFs are fluctuating in regards to their positions above or below their respective individual trend lines (%M/A). A break below, represented by a negative number, shows weakness, while a break above, represented by a positive percentage, shows strength.
For hundreds of ETF/Mutual fund choices, be sure to reference Thursday’s StatSheet.
Year to date, here’s how the above candidates have fared so far:

Again, the first table above shows the position of the various ETFs in relation to their respective long term trend lines (%M/A), while the second one tracks their trailing sell stops in the “Off High” column. The “Action” column will signal a “Sell” once the -7.5% point has been taken out in the “Off High” column.
3. Trend Tracking Indexes (TTIs)
Our Trend Tracking Indexes (TTIs) pulled back a tad and closed as follows:
Domestic TTI: +1.52% (last close +1.58%)—Buy signal effective 10/22/2014
International TTI: +2.11% (last close +2.39%)—Buy signal effective 2/13/2015
Disclosure: I am obliged to inform you that I, as well as advisory clients of mine, own some of these listed ETFs. Furthermore, they do not represent a specific investment recommendation for you, they merely show which ETFs from the universe I track are falling within the guidelines specified.
Contact Ulli