
1. Moving the Markets
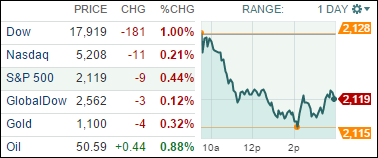
Equities pulled back as a result of IBM and United Technologies putting the first negative on the board this earnings season just prior to the heavyweights, Apple and Microsoft, issuing their quarterly report cards after today’s close.
The major indexes are still near record highs and, after having been on a tear over the past 1-1/2 weeks, a pullback was way overdue. It’ll be a continued tug-of-war over the next 10 trading sessions or so until it becomes clear whether the bulls can remain the upper hand.
Other than earnings, there were no market moving events.
All of our 10 ETFs in the Spotlight participated in the pullback with Consumer Staples (XLP) holding up the best with -0.24%, while the Select Dividend ETF (DVY) fared the worst by giving back -0.69%.
2. ETFs in the Spotlight
In case you missed the announcement and description of this section, you can read it here again.
It features 10 broadly diversified ETFs from my HighVolume list as posted every Monday. Furthermore, they are screened for the lowest MaxDD% number meaning they have been showing better resistance to temporary sell offs than all others over the past year.
Here are the 10 candidates:
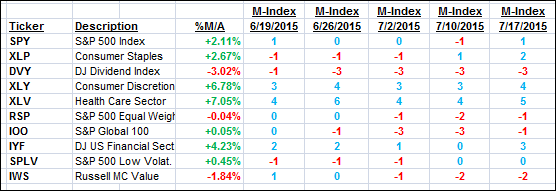
The above table simply demonstrates the magnitude with which some of the ETFs are fluctuating in regards to their positions above or below their respective individual trend lines (%M/A). A break below, represented by a negative number, shows weakness, while a break above, represented by a positive percentage, shows strength.
For hundreds of ETF/Mutual fund choices, be sure to reference Thursday’s StatSheet.
Year to date, here’s how the above candidates have fared so far:
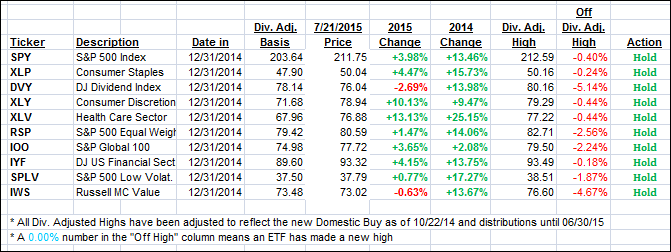
Again, the first table above shows the position of the various ETFs in relation to their respective long term trend lines (%M/A), while the second one tracks their trailing sell stops in the “Off High” column. The “Action” column will signal a “Sell” once the -7.5% point has been taken out in the “Off High” column.
3. Trend Tracking Indexes (TTIs)
Our Trend Tracking Indexes (TTIs) retreated but remain in bullish territory:
Domestic TTI: +1.66% (last close +1.82%)—Buy signal effective 10/22/2014
International TTI: +2.27% (last close +2.42%)—Buy signal effective 2/13/2015
Disclosure: I am obliged to inform you that I, as well as advisory clients of mine, own some of these listed ETFs. Furthermore, they do not represent a specific investment recommendation for you, they merely show which ETFs from the universe I track are falling within the guidelines specified.
Contact Ulli