
1. Moving the Markets
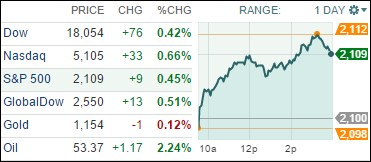
Equities managed to inch higher for the 4th day in a row and added to their recent gains. From last Wednesday’s low for then month, the S&P has managed to rally over 3%, which was strictly based on hope for a resolution in Greece.
Today’s downer was the disappointing June retail sales number at -0.3% but, this is nowadays a positive for the market as it may change the Fed’s interest rate hike, which has been on the front burner for quite some time now and is maybe scheduled for September.
Right now, all eyes are on Wednesday’s session where fireworks in form of a variety of events are on the menu. Starting with China’s GDP announcement, we’ll move to Fed chief Yellen’s testimony about the economic outlook, which maybe interrupted by the decision of the Greek parliament as to whether the new and extremely stringent reform measures negotiated last weekend will be accepted or not.
All of our 10 ETFs in the Spotlight again joined the upward momentum and added to the gains of the past 3 days. Healthcare (XLV) took to billing with +1.05%, while Consumer Discretionaries (XLY), yesterday’s winner, managed a meager +0.16%.
2. ETFs in the Spotlight
In case you missed the announcement and description of this section, you can read it here again.
It features 10 broadly diversified ETFs from my HighVolume list as posted every Monday. Furthermore, they are screened for the lowest MaxDD% number meaning they have been showing better resistance to temporary sell offs than all others over the past year.
Here are the 10 candidates:
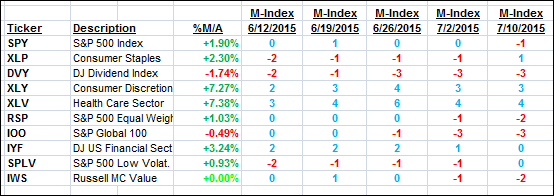
The above table simply demonstrates the magnitude with which some of the ETFs are fluctuating in regards to their positions above or below their respective individual trend lines (%M/A). A break below, represented by a negative number, shows weakness, while a break above, represented by a positive percentage, shows strength.
For hundreds of ETF/Mutual fund choices, be sure to reference Thursday’s StatSheet.
Year to date, here’s how the above candidates have fared so far:
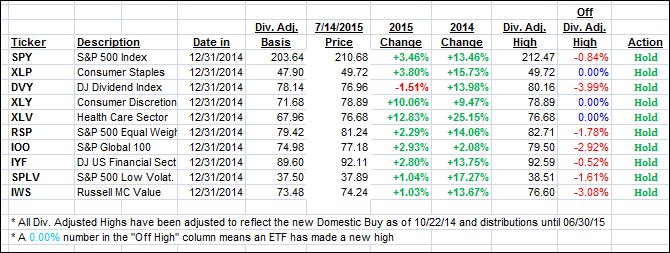
Again, the first table above shows the position of the various ETFs in relation to their respective long term trend lines (%M/A), while the second one tracks their trailing sell stops in the “Off High” column. The “Action” column will signal a “Sell” once the -7.5% point has been taken out in the “Off High” column.
3. Trend Tracking Indexes (TTIs)
Our Trend Tracking Indexes (TTIs) again moved deeper into bullish territory and closed the day as follows:
Domestic TTI: +1.58% (last close +1.27%)—Buy signal effective 10/22/2014
International TTI: +2.39% (last close +1.88%)—Buy signal effective 2/13/2015
Disclosure: I am obliged to inform you that I, as well as advisory clients of mine, own some of these listed ETFs. Furthermore, they do not represent a specific investment recommendation for you, they merely show which ETFs from the universe I track are falling within the guidelines specified.
Contact Ulli