
1. Moving the Markets
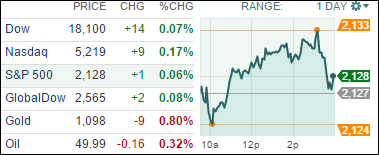
Equities looked a little tired after the solid run of the past 1-1/2 weeks and ended only slightly changed. The S&P managed to temporarily climb above its old record high (on very meager volume) but was not able to hold the gain and ended up 1 point above the unchanged line.
So far earnings have been better than expected, which has helped the recent run along with good M&A activity. Greece’s problems are allegedly resolved with a final pact to be on the table anytime now, so that pressure is off the markets for the time being. Of course, as I have stated before, the Greek crisis has merely been postponed and can rear its ugly head anytime; that is if you don’t view things through rose-colored glasses.
Despite the recent rally, we’re still range bound and are nearing the upper end. Data showed that the S&P hasn’t closed in 2015 more than 3.5% above or below where it started the year. I am not sure what value this fact has for investors, but some claim that this bull has another 2 years of life left. Well, be that as it may, we’ll continue to follow the trends and let our sell stops be the guide in determining whether this bull is still alive or not.
7 of our 10 ETFs in the Spotlight climbed higher as the indexes ended up only slightly change. Leading the group was Healthcare (XLV) with +0.32%; on the downside, the Mid-Cap Value ETF (IWS) surrendered -0.42%.
2. ETFs in the Spotlight
In case you missed the announcement and description of this section, you can read it here again.
It features 10 broadly diversified ETFs from my HighVolume list as posted every Monday. Furthermore, they are screened for the lowest MaxDD% number meaning they have been showing better resistance to temporary sell offs than all others over the past year.
Here are the 10 candidates:
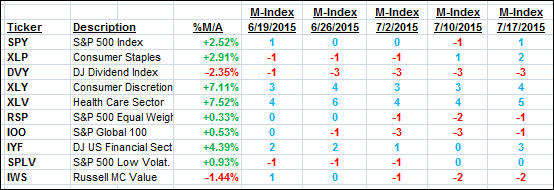
The above table simply demonstrates the magnitude with which some of the ETFs are fluctuating in regards to their positions above or below their respective individual trend lines (%M/A). A break below, represented by a negative number, shows weakness, while a break above, represented by a positive percentage, shows strength.
For hundreds of ETF/Mutual fund choices, be sure to reference Thursday’s StatSheet.
Year to date, here’s how the above candidates have fared so far:
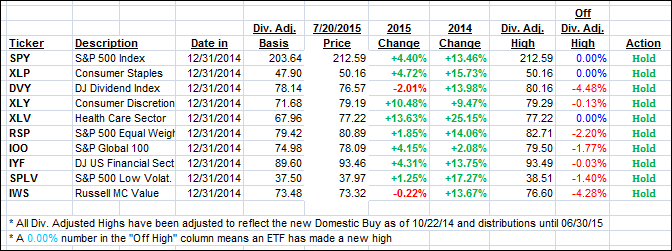
Again, the first table above shows the position of the various ETFs in relation to their respective long term trend lines (%M/A), while the second one tracks their trailing sell stops in the “Off High” column. The “Action” column will signal a “Sell” once the -7.5% point has been taken out in the “Off High” column.
3. Trend Tracking Indexes (TTIs)
Our Trend Tracking Indexes (TTIs) changed only immaterially and closed as follows:
Domestic TTI: +1.82% (last close +1.72%)—Buy signal effective 10/22/2014
International TTI: +2.42% (last close +2.41%)—Buy signal effective 2/13/2015
Disclosure: I am obliged to inform you that I, as well as advisory clients of mine, own some of these listed ETFs. Furthermore, they do not represent a specific investment recommendation for you, they merely show which ETFs from the universe I track are falling within the guidelines specified.
Contact Ulli