
1. Moving the Markets
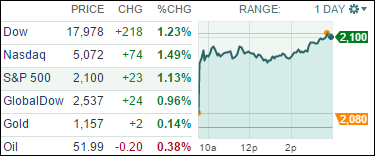
The bulls had their way as the rally continued for the third straight day with the S&P 500 reclaiming the 2,100 level. The driver was a new agreement, where Greece ended up in total capitulation by giving up much sovereignity in turn for a third bailout program.
This type of deal came as a total surprise but before in can be finalized it must be approved by the national parliaments, which is expected to happen by the end of the week. Optimism persists that Greece will accept all conditions and thereby remain in the Eurozone. As a consequence, the markets are back in “risk on” mode.
Domestically, earnings will be on the menu for the next few weeks, and so far there have been no surprise announcements that companies may disappoint. If that holds, equities could be finding more support.
All of our 10 ETFs in the Spotlight participated in this rally and closed solidly higher. The leader for the day was Consumer Discretionaries (XLY), which gained 1.44%. On the laggard side, but still gainging nicely, was the Dividend ETF (DVY), which captured 0.69%.
2. ETFs in the Spotlight
In case you missed the announcement and description of this section, you can read it here again.
It features 10 broadly diversified ETFs from my HighVolume list as posted every Monday. Furthermore, they are screened for the lowest MaxDD% number meaning they have been showing better resistance to temporary sell offs than all others over the past year.
Here are the 10 candidates:
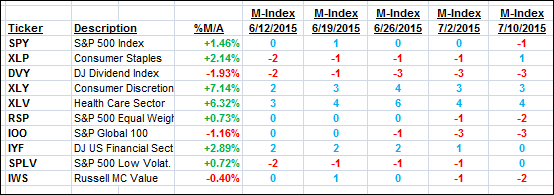
The above table simply demonstrates the magnitude with which some of the ETFs are fluctuating in regards to their positions above or below their respective individual trend lines (%M/A). A break below, represented by a negative number, shows weakness, while a break above, represented by a positive percentage, shows strength.
For hundreds of ETF/Mutual fund choices, be sure to reference Thursday’s StatSheet.
Year to date, here’s how the above candidates have fared so far:
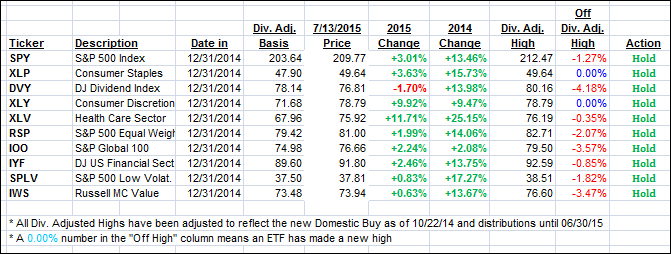
Again, the first table above shows the position of the various ETFs in relation to their respective long term trend lines (%M/A), while the second one tracks their trailing sell stops in the “Off High” column. The “Action” column will signal a “Sell” once the -7.5% point has been taken out in the “Off High” column.
3. Trend Tracking Indexes (TTIs)
Our Trend Tracking Indexes (TTIs) joined the bullish run and closed higher ending up deeper on the bullish side of their respective trend lines:
Domestic TTI: +1.27% (last close +0.80%)—Buy signal effective 10/22/2014
International TTI: +1.88% (last close +1.07%)—Buy signal effective 2/13/2015
Disclosure: I am obliged to inform you that I, as well as advisory clients of mine, own some of these listed ETFs. Furthermore, they do not represent a specific investment recommendation for you, they merely show which ETFs from the universe I track are falling within the guidelines specified.
Contact Ulli