
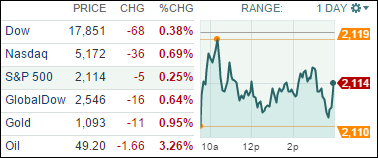
1. Moving the Markets
Tech stocks continued to be a drag on the major indexes after results from Miscrosoft and Apple disappointed. As is always the case, Apple certainly did not do poorly; it’s just that expectations are so overblown than anything close to realty seems to cause a pullback.
In the bigger picture, the question remains whether the weakness in tech stocks is a reflection of how the economy is performing, and if this is a harbinger of things to come.
Despite the weakness, 8 of our 10 ETFs in the Spotlight managed to buck the trend and close higher. Leading on the upside were the Financials (IYF) with +0.62%, while the downside was headed by the Global 100 with a -0.77% loss.
2. ETFs in the Spotlight
In case you missed the announcement and description of this section, you can read it here again.
It features 10 broadly diversified ETFs from my HighVolume list as posted every Monday. Furthermore, they are screened for the lowest MaxDD% number meaning they have been showing better resistance to temporary sell offs than all others over the past year.
Here are the 10 candidates:
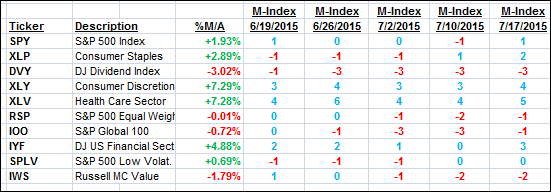
The above table simply demonstrates the magnitude with which some of the ETFs are fluctuating in regards to their positions above or below their respective individual trend lines (%M/A). A break below, represented by a negative number, shows weakness, while a break above, represented by a positive percentage, shows strength.
For hundreds of ETF/Mutual fund choices, be sure to reference Thursday’s StatSheet.
Year to date, here’s how the above candidates have fared so far:
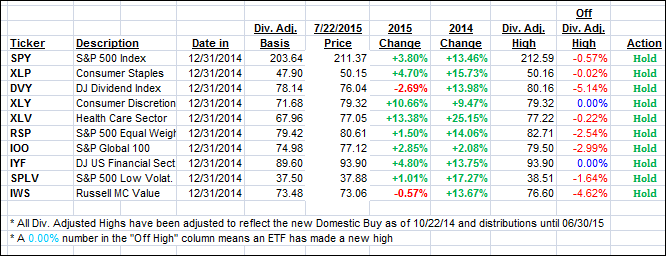
Again, the first table above shows the position of the various ETFs in relation to their respective long term trend lines (%M/A), while the second one tracks their trailing sell stops in the “Off High” column. The “Action” column will signal a “Sell” once the -7.5% point has been taken out in the “Off High” column.
3. Trend Tracking Indexes (TTIs)
Our Trend Tracking Indexes (TTIs) pulled back a little as today’s session showed no clear direction:
Domestic TTI: +1.60% (last close +1.66%)—Buy signal effective 10/22/2014
International TTI: +1.74% (last close +2.27%)—Buy signal effective 2/13/2015
Disclosure: I am obliged to inform you that I, as well as advisory clients of mine, own some of these listed ETFs. Furthermore, they do not represent a specific investment recommendation for you, they merely show which ETFs from the universe I track are falling within the guidelines specified.
Contact Ulli