
1. Moving the Markets
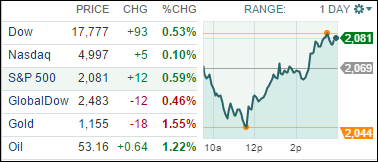
Things looked very dicey for the S&P 500, and the markets in general, as the indexes dropped sharply after the opening. The S&P touched the 2,044 level, which was a break below its widely followed 200-day moving average.
A close around the lows of the day may have generated a “Sell” signal for domestic equity funds/ETFs, but the Greek PM came to the rescue by proposing some interim financing until the end of July.
That was all it took, and the hope rally, which at this point looks like a giant dead cat bounce, shifted into high gear with the indexes staging an amazing turnaround as the S&P sported an intra-day range of 37 points. As I mentioned before, volatility is here to stay a while longer until the mess in Greece gets sorted out—one way or another.
All of our 10 ETFs in the Spotlight participated and closed up with Consumer Staples (XLP) leading the charge at +2.06%, while the Financials (IYF) lagged with a more modest gain of 0.18%.
2. ETFs in the Spotlight
In case you missed the announcement and description of this section, you can read it here again.
It features 10 broadly diversified ETFs from my HighVolume list as posted every Monday. Furthermore, they are screened for the lowest MaxDD% number meaning they have been showing better resistance to temporary sell offs than all others over the past year.
Here are the 10 candidates:
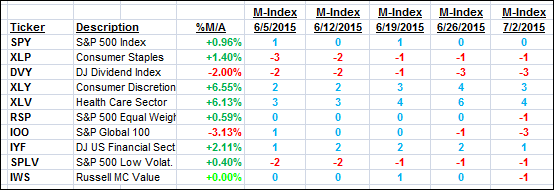
The above table simply demonstrates the magnitude with which some of the ETFs are fluctuating in regards to their positions above or below their respective individual trend lines (%M/A). A break below, represented by a negative number, shows weakness, while a break above, represented by a positive percentage, shows strength.
For hundreds of ETF/Mutual fund choices, be sure to reference Thursday’s StatSheet.
Year to date, here’s how the above candidates have fared so far:
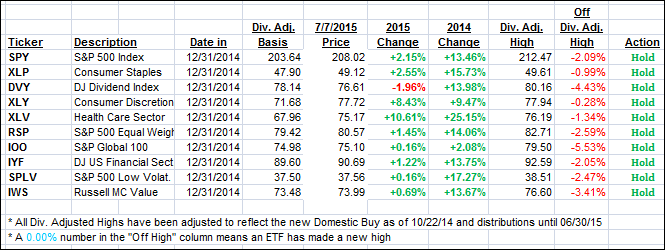
Again, the first table above shows the position of the various ETFs in relation to their respective long term trend lines (%M/A), while the second one tracks their trailing sell stops in the “Off High” column. The “Action” column will signal a “Sell” once the -7.5% point has been taken out in the “Off High” column.
3. Trend Tracking Indexes (TTIs)
Our Trend Tracking Indexes (TTIs) were mixed as the Domestic one improved while the International one headed closer towards a break into bear market territory. Right now, however, the bulls still have the upper hand as today’s close shows:
Domestic TTI: +1.10% (last close +0.85%)—Buy signal effective 10/22/2014
International TTI: +0.37% (last close +0.51%)—Buy signal effective 2/13/2015
Disclosure: I am obliged to inform you that I, as well as advisory clients of mine, own some of these listed ETFs. Furthermore, they do not represent a specific investment recommendation for you, they merely show which ETFs from the universe I track are falling within the guidelines specified.
Contact Ulli