
1. Moving the Markets
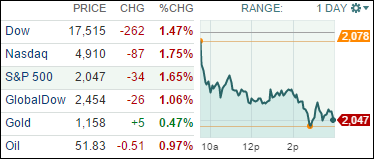
For a change, at least on Wall Street, the problems in Greece seemed to have moved to the back-burner, while issues in China, such as their over 30% stock market slide in the past 3 weeks took center stage. The concern is that China’s equity slide will hurt their economy, the second largest in the world, and there will be more potential spillover risks from that fallout.
Unfortunately, yesterday’s dead cat bounce was confirmed as all gains were given back putting the S&P below its widely followed 200-day moving average. Souring the mood even further was a 3-1/2 hour malfunction of the New York Stock Exchange, followed by the Wall Street Journal going offline and United Airlines experiencing a computer glitch, which grounded their fleet of airplanes.
Then the FOMC released their minutes casting more uncertainty as to whether the economy was sufficiently strong to absorb a planned raise in interest rates. They did acknowledge, however, that uncertainty exists in regards to the pace of economic growth abroad and the open question as to whether Greece and its creditors would reach an agreement.
It was a day to forget; what matters to us is whether the current bullish trend can be sustained or not. Take a look at section 3 below to see how our Trend Tracking Indexes (TTIs) were affected by today’s session.
All of our 10 ETFs in the Spotlight succumbed to the bears and closed lower headed to the downside by Consumer Discretionaries (XLY) with -1.90%, while Consumer Staples (XLP) gave back the least but still surrendered -1.12%.
2. ETFs in the Spotlight
In case you missed the announcement and description of this section, you can read it here again.
It features 10 broadly diversified ETFs from my HighVolume list as posted every Monday. Furthermore, they are screened for the lowest MaxDD% number meaning they have been showing better resistance to temporary sell offs than all others over the past year.
Here are the 10 candidates:
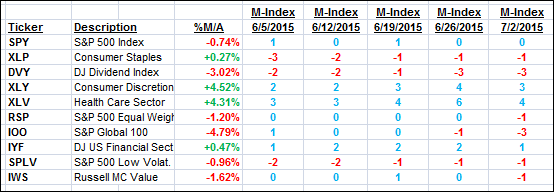
The above table simply demonstrates the magnitude with which some of the ETFs are fluctuating in regards to their positions above or below their respective individual trend lines (%M/A). A break below, represented by a negative number, shows weakness, while a break above, represented by a positive percentage, shows strength.
For hundreds of ETF/Mutual fund choices, be sure to reference Thursday’s StatSheet.
Year to date, here’s how the above candidates have fared so far:
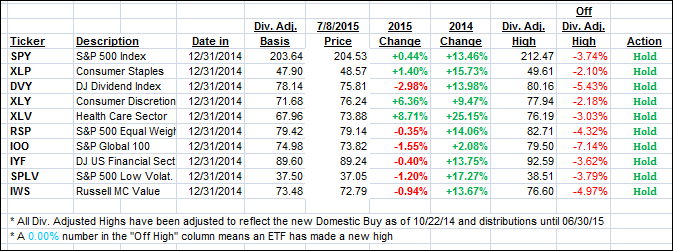
Again, the first table above shows the position of the various ETFs in relation to their respective long term trend lines (%M/A), while the second one tracks their trailing sell stops in the “Off High” column. The “Action” column will signal a “Sell” once the -7.5% point has been taken out in the “Off High” column.
3. Trend Tracking Indexes (TTIs)
Our Trend Tracking Indexes (TTIs) both headed south, but the Domestic one remained on the bullish side of its trend line while the International one slipped below it. Here’s how we closed:
Domestic TTI: +0.35% (last close +1.10%)—Buy signal effective 10/22/2014
International TTI: -1.01% (last close +0.37%)—Buy signal effective 2/13/2015
I will watch for a couple of days to see if the International TTI actually stays below its trend line before issuing a “Sell” signal for that arena.
Disclosure: I am obliged to inform you that I, as well as advisory clients of mine, own some of these listed ETFs. Furthermore, they do not represent a specific investment recommendation for you, they merely show which ETFs from the universe I track are falling within the guidelines specified.
Contact Ulli