
1. Moving the Markets
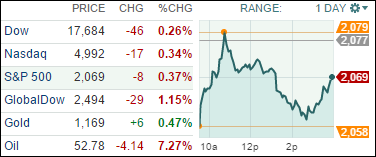
It was a roller coaster ride as the major indexes dropped at the open, then managed to climb above the unchanged line before slipping again but rallying into the close.
So far, the fallout has been worse in Europe but uncertainty and subsequent volatility may stay with us for a while. Via Sunday’s referendum, Greece essentially divorced itself from the current bailout terms, but we are in uncharted territory here, so there is no precedent as to the next steps involved.
The whipping boy of the day was oil, which got spanked and lost over 7% as the chart above shows. It is certain that the Greece story will remain in the headlines and will further affect world markets. The degree of any potential fallout is unknown, but to us, following the major trends in the markets, the only thing that matters is whether this current uptrend is sustained or not. Be sure to tune in regularly to watch the Trend Tracking Indexes (TTI) in section 3 below to see if any Sell signals are being generated.
All of our 10 ETFs in the Spotlight retreated moderately with the Global 100 (IOO) taking the lead to the downside with -1.15%, while Consumer Staples (XLP) held up best by giving back only -0.08%.
2. ETFs in the Spotlight
In case you missed the announcement and description of this section, you can read it here again.
It features 10 broadly diversified ETFs from my HighVolume list as posted every Monday. Furthermore, they are screened for the lowest MaxDD% number meaning they have been showing better resistance to temporary sell offs than all others over the past year.
Here are the 10 candidates:
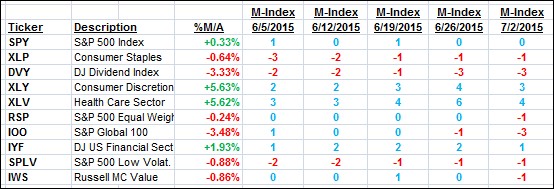
The above table simply demonstrates the magnitude with which some of the ETFs are fluctuating in regards to their positions above or below their respective individual trend lines (%M/A). A break below, represented by a negative number, shows weakness, while a break above, represented by a positive percentage, shows strength.
For hundreds of ETF/Mutual fund choices, be sure to reference Thursday’s StatSheet.
Year to date, here’s how the above candidates have fared so far:
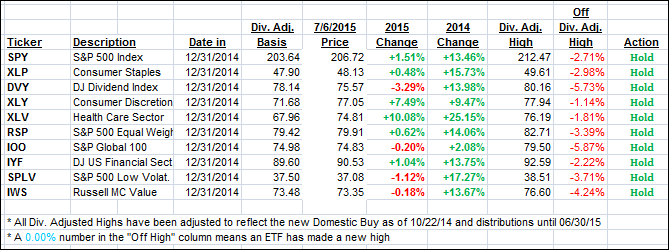
Again, the first table above shows the position of the various ETFs in relation to their respective long term trend lines (%M/A), while the second one tracks their trailing sell stops in the “Off High” column. The “Action” column will signal a “Sell” once the -7.5% point has been taken out in the “Off High” column.
3. Trend Tracking Indexes (TTIs)
Our Trend Tracking Indexes (TTIs) again showed weakness with especially the International one being severely affected by the Greek referendum. As is usually the case, if markets slip a little more, we most likely will see the International TTI turn bearish first.
Here’s how we closed:
Domestic TTI: +0.85% (last close +0.92%)—Buy signal effective 10/22/2014
International TTI: +0.51% (last close +1.67%)—Buy signal effective 2/13/2015
Disclosure: I am obliged to inform you that I, as well as advisory clients of mine, own some of these listed ETFs. Furthermore, they do not represent a specific investment recommendation for you, they merely show which ETFs from the universe I track are falling within the guidelines specified.
Contact Ulli