
1. Moving the Markets
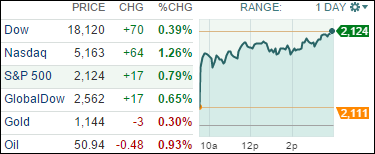
Taking a cue from the European markets, U.S. equities joined the party and moved higher with Greek exit fears subsiding after approval of new austerity programs.
Giving an assist to the markets was ECB’s Mario Draghi who commented on their willingness to expand aid to some of the troubled banks. That was all it took, and U.S. equities never looked back.
What was not explained was that a Greek deal is far from being certain. Several of the European parliaments, including Germany’s, have to agree on letting their respective FinMins enter into a new agreement. Then they have to negotiate the actual detailed bailout deal with Greece, which has to be accepted again by the German Parliament, after which then the Greece parliament will have to give its stamp of approval, a process which might take some 6-8 weeks.
As you can see, we are nowhere near that euphoric point where we could declare the Greek situation as being resolved. But, today, these minor details did not matter to the markets; it was up, up and away.
All of our 10 ETFs in the Spotlight enjoyed the renewed upward momentum and closed higher led by Consumer Staples (XLP) with a gain of 1.03%. Lagging the group was the Mid-Cap Value ETF (IWS) which added a more modest 0.46%.
2. ETFs in the Spotlight
In case you missed the announcement and description of this section, you can read it here again.
It features 10 broadly diversified ETFs from my HighVolume list as posted every Monday. Furthermore, they are screened for the lowest MaxDD% number meaning they have been showing better resistance to temporary sell offs than all others over the past year.
Here are the 10 candidates:
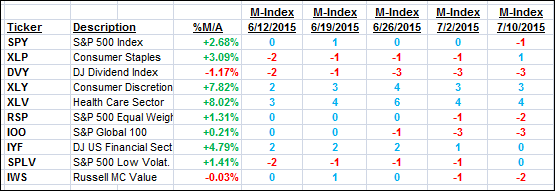
The above table simply demonstrates the magnitude with which some of the ETFs are fluctuating in regards to their positions above or below their respective individual trend lines (%M/A). A break below, represented by a negative number, shows weakness, while a break above, represented by a positive percentage, shows strength.
For hundreds of ETF/Mutual fund choices, be sure to reference Thursday’s StatSheet.
Year to date, here’s how the above candidates have fared so far:
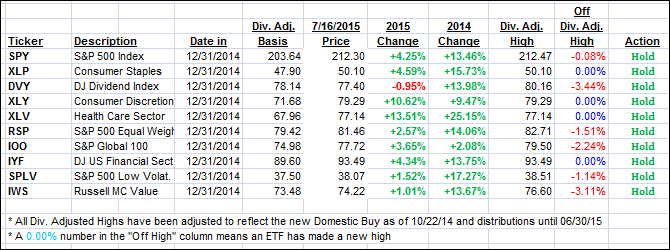
Again, the first table above shows the position of the various ETFs in relation to their respective long term trend lines (%M/A), while the second one tracks their trailing sell stops in the “Off High” column. The “Action” column will signal a “Sell” once the -7.5% point has been taken out in the “Off High” column.
3. Trend Tracking Indexes (TTIs)
Our Trend Tracking Indexes (TTIs) improved and moved deeper into bullish territory:
Domestic TTI: +1.83% (last close +1.52%)—Buy signal effective 10/22/2014
International TTI: +2.66% (last close +2.11%)—Buy signal effective 2/13/2015
Disclosure: I am obliged to inform you that I, as well as advisory clients of mine, own some of these listed ETFs. Furthermore, they do not represent a specific investment recommendation for you, they merely show which ETFs from the universe I track are falling within the guidelines specified.
Contact Ulli