
1. Moving the Markets
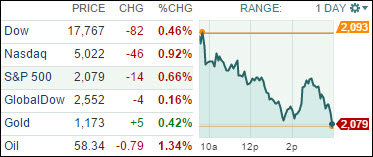
Last week’s slide continued as the major indexes headed south again, and even the last hour’s rebound attempt had no staying power, so we closed at the day’s lows.
We’re stuck in a slump with the Dow now having dipped into negative territory year-to-date, while the S&P 500 has come off its May 21st high by more than 2%. I think we’re seeing the fallout from last week’s positive jobs report, which has brought a rate increase by the Fed back into the picture. Based on this reaction, it seems that Wall Street would rather have lower rates than a stronger economy.
A new driver is needed to push the indexes out of the doldrums. On the horizon lurks Thursday’s retail sales report, which could confirm a more solid economy should it exceed expectations. If it turns out weaker than expected, we may very well see a rebound rally.
With today’s broad retreat, it was no surprise that all of our 10 ETFs in the Spotlight headed down that slippery slope and closed lower. Giving back the most was Consumer Consumer Discretionaries (XLY) with -0.71%, while Consumer Staples (XLP) held up best with a minor loss of 0.04%.
2. ETFs in the Spotlight
In case you missed the announcement and description of this section, you can read it here again.
It features 10 broadly diversified ETFs from my HighVolume list as posted every Monday. Furthermore, they are screened for the lowest MaxDD% number meaning they have been showing better resistance to temporary sell offs than all others over the past year.
Here are the 10 candidates:
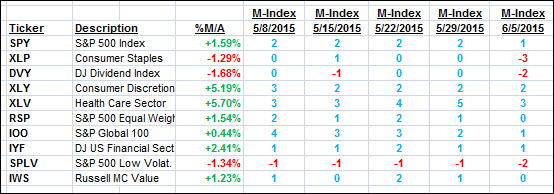
The above table simply demonstrates the magnitude with which some of the ETFs are fluctuating in regards to their positions above or below their respective individual trend lines (%M/A). A break below, represented by a negative number, shows weakness, while a break above, represented by a positive percentage, shows strength.
For hundreds of ETF/Mutual fund choices, be sure to reference Thursday’s StatSheet.
Year to date, here’s how the above candidates have fared so far:
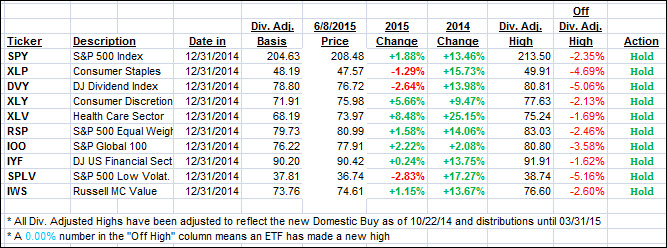
Again, the first table above shows the position of the various ETFs in relation to their respective long term trend lines (%M/A), while the second one tracks their trailing sell stops in the “Off High” column. The “Action” column will signal a “Sell” once the -7.5% point has been taken out in the “Off High” column.
3. Trend Tracking Indexes (TTIs)
Our Trend Tracking Indexes (TTIs) continued their slide but remain above their respective trend lines by the following percentages:
Domestic TTI: +1.44% (last close +1.70%)—Buy signal effective 10/22/2014
International TTI: +2.98% (last close +3.21%)—Buy signal effective 2/13/2015
Disclosure: I am obliged to inform you that I, as well as advisory clients of mine, own some of these listed ETFs. Furthermore, they do not represent a specific investment recommendation for you, they merely show which ETFs from the universe I track are falling within the guidelines specified.
Contact Ulli