
1. Moving the Markets
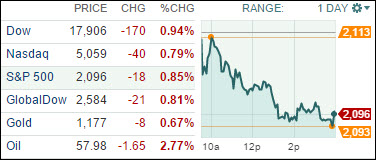
Stocks dropped sharply after Greece said it won’t make a scheduled loan repayment Friday, and the IMF lowered its U.S. economic outlook as it urged the Federal Reserve not to raise rates in 2015. Energy stocks were one of the hardest hit sectors as oil prices fell for a second day. U.S. benchmark crude fell $1.79 to $57.87 a barrel on the New York Mercantile Exchange.
Investors have been anxious about possible default and a Greek exit from the eurozone as negotiations over the debt-plagued country has dragged on for months. Greece owes its creditors — the IMF, the European Central Bank and the European Commission – a total of about 1.6 billion euros by the end of the month.
In corporate news, shares of both T-Mobile and Dish jumped after it was reported that the two companies were in merger talks. Dish (DISH) rose 4.9% and T-Mobile (TMUS) climbed 2.6%.
And, back to interest rates. Interest rate worries also continued to weigh on the markets. The International Monetary Fund said in its annual review of the U.S. economy that the Fed should wait until the first half of 2016 before raising interest rates because inflation remains too low and there are significant uncertainties as to the future resilience of economic growth.
Downward momentum accelerated today, and all of our 10 ETFs in the Spotlight slipped and closed lower. Sliding the most was the Global 100 (IOO) with a loss of 1.03%, while Healthcare (XLV) held up best by giving back only 0.69%.
2. ETFs in the Spotlight
In case you missed the announcement and description of this section, you can read it here again.
It features 10 broadly diversified ETFs from my HighVolume list as posted every Monday. Furthermore, they are screened for the lowest MaxDD% number meaning they have been showing better resistance to temporary sell offs than all others over the past year.
Here are the 10 candidates:
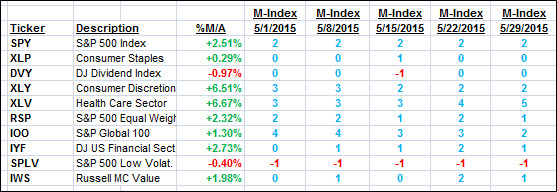
The above table simply demonstrates the magnitude with which some of the ETFs are fluctuating in regards to their positions above or below their respective individual trend lines (%M/A). A break below, represented by a negative number, shows weakness, while a break above, represented by a positive percentage, shows strength.
For hundreds of ETF/Mutual fund choices, be sure to reference Thursday’s StatSheet.
Year to date, here’s how the above candidates have fared so far:
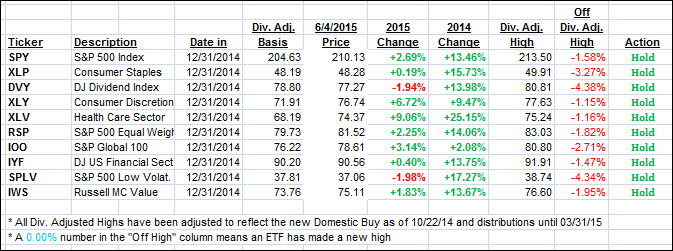
Again, the first table above shows the position of the various ETFs in relation to their respective long term trend lines (%M/A), while the second one tracks their trailing sell stops in the “Off High” column. The “Action” column will signal a “Sell” once the -7.5% point has been taken out in the “Off High” column.
3. Trend Tracking Indexes (TTIs)
Our Trend Tracking Indexes (TTIs) were affected by today’s pullback as both of them closed lower but remain on the bullish side of their respective trend lines by the following percentages:
Domestic TTI: +1.89% (last close +2.28%)—Buy signal effective 10/22/2014
International TTI: +3.93% (last close +4.53%)—Buy signal effective 2/13/2015
Disclosure: I am obliged to inform you that I, as well as advisory clients of mine, own some of these listed ETFs. Furthermore, they do not represent a specific investment recommendation for you, they merely show which ETFs from the universe I track are falling within the guidelines specified.
Contact Ulli