
1. Moving the Markets
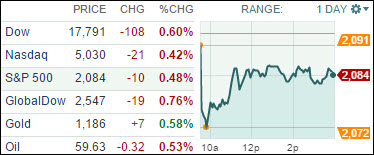
Global markets started the week on a softer note after talks on the Greece bailout broke down on Sunday. The Dow Jones industrial average dropped 108 points to end back in the red for 2015 as both domestic and global concerns weighed on investors. Chief concerns include the ongoing stalemate between Greece and its creditors, and this week’s Federal Reserve meeting on interest rate policy.
The Fed kicks off a two-day meeting on rates tomorrow and will issue a policy statement Wednesday. Fed Chair Janet Yellen will also face off with the press after Wednesday’s meeting adjourns, and will discuss the Fed’s current economic outlook and hopefully provide investors with a road map as to when the Fed plans to raise rates and why.
In M&A news, we heard today that Target (TGT) intends to sell its pharmacy business to CVS (CVS) for $1.9 billion. Many analysts are claiming ‘bargaining power’ as one of the primary drivers behind the deal. With Target’s pharmacy distribution channels, CVS should have greater bargaining power with drug makers for lower prices, which could turn pharmacy margins upside down in Target stores. Pharmacies will remain in Target stores, but carry the CVS brand name.
9 of our 10 ETFs in the Spotlight headed south led by the Low Volatility ETF (SPLV) with a loss of 0.83%. Bucking the trend was Healthcare (XLV), which eked out a gain of 0.12%.
2. ETFs in the Spotlight
In case you missed the announcement and description of this section, you can read it here again.
It features 10 broadly diversified ETFs from my HighVolume list as posted every Monday. Furthermore, they are screened for the lowest MaxDD% number meaning they have been showing better resistance to temporary sell offs than all others over the past year.
Here are the 10 candidates:
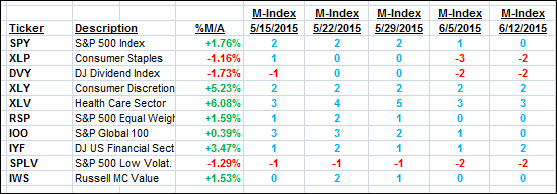
The above table simply demonstrates the magnitude with which some of the ETFs are fluctuating in regards to their positions above or below their respective individual trend lines (%M/A). A break below, represented by a negative number, shows weakness, while a break above, represented by a positive percentage, shows strength.
For hundreds of ETF/Mutual fund choices, be sure to reference Thursday’s StatSheet.
Year to date, here’s how the above candidates have fared so far:
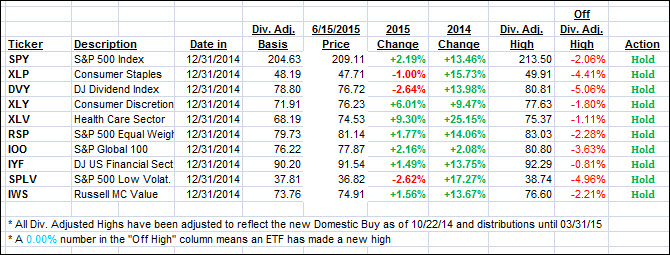
Again, the first table above shows the position of the various ETFs in relation to their respective long term trend lines (%M/A), while the second one tracks their trailing sell stops in the “Off High” column. The “Action” column will signal a “Sell” once the -7.5% point has been taken out in the “Off High” column.
3. Trend Tracking Indexes (TTIs)
Our Trend Tracking Indexes (TTIs) pulled back a little more as the bears remained in charge. However, we’re still on the bullish side of our trend lines by the following percentages:
Domestic TTI: +1.38% (last close +1.59%)—Buy signal effective 10/22/2014
International TTI: +2.72% (last close +3.33%)—Buy signal effective 2/13/2015
Disclosure: I am obliged to inform you that I, as well as advisory clients of mine, own some of these listed ETFs. Furthermore, they do not represent a specific investment recommendation for you, they merely show which ETFs from the universe I track are falling within the guidelines specified.
Contact Ulli