
1. Moving the Markets
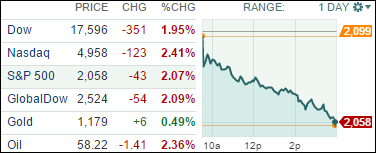
Compared to the rest of the world, the domestic indexes held up fairly well as Greece’s negotiations unraveled as its local banks along with their stock market were closed. Nevertheless, the S&P 500 had its worst one-day showing in 2015.
It was a bad news day all the way around as Greece’s Prime Minister made a surprise announcement over the weekend by calling for a referendum on July 5 to let his people decide as to whether to accept the offered reform packages by its lenders or not. These developments hit the European markets especially hard with the German DAX losing 3.56% while all Asian markets ended in the red as well.
Not helping matters was shaky news out of China and words from the Puerto Rico governor that the U.S. commonwealth is facing a financial crisis due to its $70 billion muni debt problem, which it can’t pay back.
With today’s broad pullback, all of our 10 ETFs in the Spotlight succumbed to the bearish forces. Leading the downside was Healthcare (XLV), which surrendered 2.42% while Consumer Staples (XLP) held up best under the circumstances by giving back only 1.55%.
Please see section 3 below for today’s effect on our Trend Tracking Indexes (TTIs).
2. ETFs in the Spotlight
In case you missed the announcement and description of this section, you can read it here again.
It features 10 broadly diversified ETFs from my HighVolume list as posted every Monday. Furthermore, they are screened for the lowest MaxDD% number meaning they have been showing better resistance to temporary sell offs than all others over the past year.
Here are the 10 candidates:
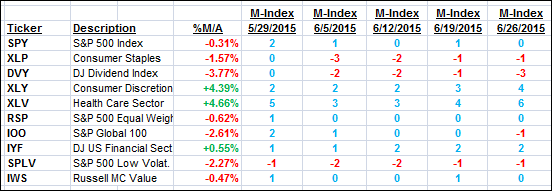
The above table simply demonstrates the magnitude with which some of the ETFs are fluctuating in regards to their positions above or below their respective individual trend lines (%M/A). A break below, represented by a negative number, shows weakness, while a break above, represented by a positive percentage, shows strength.
For hundreds of ETF/Mutual fund choices, be sure to reference Thursday’s StatSheet.
Year to date, here’s how the above candidates have fared so far:
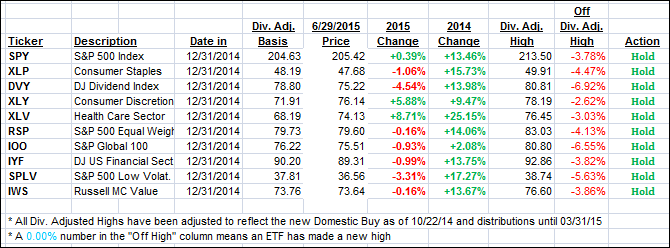
Again, the first table above shows the position of the various ETFs in relation to their respective long term trend lines (%M/A), while the second one tracks their trailing sell stops in the “Off High” column. The “Action” column will signal a “Sell” once the -7.5% point has been taken out in the “Off High” column.
3. Trend Tracking Indexes (TTIs)
Our Trend Tracking Indexes (TTIs) headed south and closed as follows:
Domestic TTI: +0.74% (last close +1.61%)—Buy signal effective 10/22/2014
International TTI: +1.85% (last close +3.35%)—Buy signal effective 2/13/2015
While our TTIs remain on the bullish side, any more downside action over the next few days could very likely generate a “Sell” signal. Be sure to tune in for the latest updates.
Disclosure: I am obliged to inform you that I, as well as advisory clients of mine, own some of these listed ETFs. Furthermore, they do not represent a specific investment recommendation for you, they merely show which ETFs from the universe I track are falling within the guidelines specified.
Contact Ulli