
1. Moving the Markets
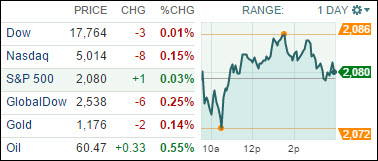
U.S. stocks were little changed today, with only the S&P managing to close in the green, as investors are processing economic data and awaiting further developments in Greece’s debt negotiations with creditors. In economic news, U.S. wholesale inventories were higher than expected in April, while a separate report showed small businesses confidence increased in May.
In corporate news, airline shares fell for a sixth day on concerns about slowing growth and rising capacity, while HSBC shares traded slightly lower after the bank announced cost-cutting efforts that included 50,000 job cuts globally. U.S. Treasuries were lower today.
General Electric said today that it has agreed to sell its private equity financing unit to Canada Pension Plan Investment Board (Canada’s largest pension fund) in a deal valued at about $12 billion USD. GE Capital Sponsor Finance, GE’s private equity unit, has assets of more than $10 billion and offers financing for companies conducting leveraged transactions, growth funding and recapitalization. The unit includes GE Antares, a lender for midsize companies.
Our 10 ETFs in the Spotlight ended up mixed with 4 of them closing up, while 6 of them slipped. Leading the gainers was Consumer Staples (XLP) with +0.48%, while the downside was led by the Global 100 (IOO) with -0.30%.
2. ETFs in the Spotlight
In case you missed the announcement and description of this section, you can read it here again.
It features 10 broadly diversified ETFs from my HighVolume list as posted every Monday. Furthermore, they are screened for the lowest MaxDD% number meaning they have been showing better resistance to temporary sell offs than all others over the past year.
Here are the 10 candidates:
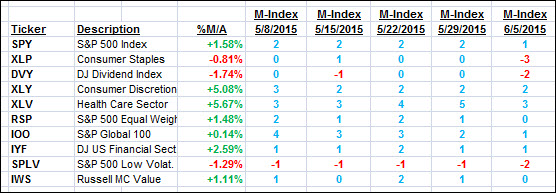
The above table simply demonstrates the magnitude with which some of the ETFs are fluctuating in regards to their positions above or below their respective individual trend lines (%M/A). A break below, represented by a negative number, shows weakness, while a break above, represented by a positive percentage, shows strength.
For hundreds of ETF/Mutual fund choices, be sure to reference Thursday’s StatSheet.
Year to date, here’s how the above candidates have fared so far:
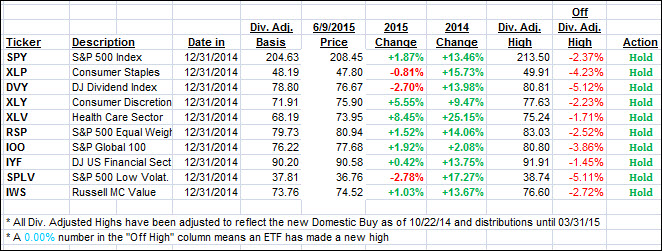
Again, the first table above shows the position of the various ETFs in relation to their respective long term trend lines (%M/A), while the second one tracks their trailing sell stops in the “Off High” column. The “Action” column will signal a “Sell” once the -7.5% point has been taken out in the “Off High” column.
3. Trend Tracking Indexes (TTIs)
Our Trend Tracking Indexes (TTIs) eased a little more but continue to show a bullish picture. Here’s how we closed:
Domestic TTI: +1.32% (last close +1.44%)—Buy signal effective 10/22/2014
International TTI: +2.65% (last close +2.98%)—Buy signal effective 2/13/2015
Disclosure: I am obliged to inform you that I, as well as advisory clients of mine, own some of these listed ETFs. Furthermore, they do not represent a specific investment recommendation for you, they merely show which ETFs from the universe I track are falling within the guidelines specified.
Contact Ulli