
1. Moving the Markets
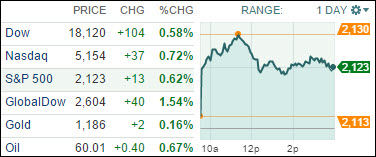
The bulls were in charge race right after the opening, and the major indexes shifted into rally mode closing on the plus side with the Nasdaq making a new record high. Despite the pullback during mid-day, we closed solidly above the unchanged line.
The driving forces, as has been the case lately, are the negotiations in Greece where new reform proposals were presented but caution remained as to the feasibility. That means it will take a few more agonizing days of deliberation along with the usual menu of accusations before any determination can be made if the primary issues have really been addressed and resolved. In other words, the Greek saga goes on…
Overall market sentiment was positive due to merger and acquisition activity in the energy field and a report that existing home sales not only grew more than expected but also surged to their highest level in over 5 years.
All of our 10 ETFs in the Spotlight picked up speed and closed up. The leader for the day was the Global 100 (IOO) with a gain of +1.22%, while the MC Value (IWS) was lagging but added 0.28%.
2. ETFs in the Spotlight
In case you missed the announcement and description of this section, you can read it here again.
It features 10 broadly diversified ETFs from my HighVolume list as posted every Monday. Furthermore, they are screened for the lowest MaxDD% number meaning they have been showing better resistance to temporary sell offs than all others over the past year.
Here are the 10 candidates:
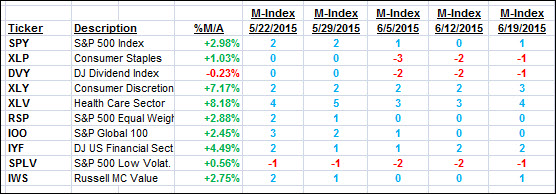
The above table simply demonstrates the magnitude with which some of the ETFs are fluctuating in regards to their positions above or below their respective individual trend lines (%M/A). A break below, represented by a negative number, shows weakness, while a break above, represented by a positive percentage, shows strength.
For hundreds of ETF/Mutual fund choices, be sure to reference Thursday’s StatSheet.
Year to date, here’s how the above candidates have fared so far:

Again, the first table above shows the position of the various ETFs in relation to their respective long term trend lines (%M/A), while the second one tracks their trailing sell stops in the “Off High” column. The “Action” column will signal a “Sell” once the -7.5% point has been taken out in the “Off High” column.
3. Trend Tracking Indexes (TTIs)
Our Trend Tracking Indexes (TTIs) headed higher with the International one surging on hopes of a resolution to the debt issues in Greece.
Here’s how we closed:
Domestic TTI: +2.32% (last close +2.13%)—Buy signal effective 10/22/2014
International TTI: +4.28% (last close +3.18%)—Buy signal effective 2/13/2015
Disclosure: I am obliged to inform you that I, as well as advisory clients of mine, own some of these listed ETFs. Furthermore, they do not represent a specific investment recommendation for you, they merely show which ETFs from the universe I track are falling within the guidelines specified.
Contact Ulli