
1. Moving the Markets
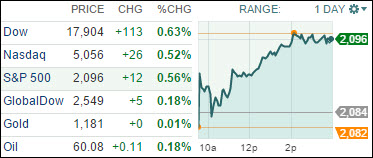
Finally, the major indexes found some some lost upward momentum and closed higher in the face of unsuccessful Greek talks and the widely anticipated outcome of a two-day Fed meeting the results of which will be published tomorrow.
However, trading was cautious as volume remained very low. While the outcome of the Fed meeting is not expected to present any major surprises, market reaction therefore may be muted but volatility will definitely ramp up on Friday as options expiration day is lurking.
While the roller-coaster, AKA the Greek debt negotiations, can affect market direction, the main driver, however, is the Fed and its policies, which is why every word of the announcement will be dissected for any hidden hints.
All of our 10 ETFs in the Spotlight recovered and sprinted higher. Consumer Staples (XLP) was the leader gaining 1.09% while the Global 100 (IOO) trailed but added 0.13%.
2. ETFs in the Spotlight
In case you missed the announcement and description of this section, you can read it here again.
It features 10 broadly diversified ETFs from my HighVolume list as posted every Monday. Furthermore, they are screened for the lowest MaxDD% number meaning they have been showing better resistance to temporary sell offs than all others over the past year.
Here are the 10 candidates:
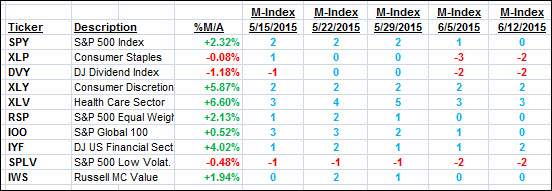
The above table simply demonstrates the magnitude with which some of the ETFs are fluctuating in regards to their positions above or below their respective individual trend lines (%M/A). A break below, represented by a negative number, shows weakness, while a break above, represented by a positive percentage, shows strength.
For hundreds of ETF/Mutual fund choices, be sure to reference Thursday’s StatSheet.
Year to date, here’s how the above candidates have fared so far:
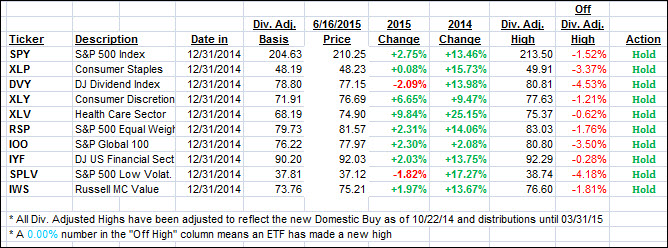
Again, the first table above shows the position of the various ETFs in relation to their respective long term trend lines (%M/A), while the second one tracks their trailing sell stops in the “Off High” column. The “Action” column will signal a “Sell” once the -7.5% point has been taken out in the “Off High” column.
3. Trend Tracking Indexes (TTIs)
Our Trend Tracking Indexes (TTIs) shifted back into bullish mode and closed higher. Here’s how we ended up:
Domestic TTI: +1.72% (last close +1.38%)—Buy signal effective 10/22/2014
International TTI: +2.76% (last close +2.72%)—Buy signal effective 2/13/2015
Disclosure: I am obliged to inform you that I, as well as advisory clients of mine, own some of these listed ETFs. Furthermore, they do not represent a specific investment recommendation for you, they merely show which ETFs from the universe I track are falling within the guidelines specified.
Contact Ulli