
1. Moving the Markets
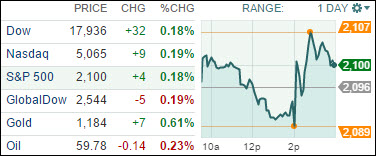
It was a choppy session as the indexes rallied at first, pulled back mid-day, rallied again and sold off into the close but managed to stay above the unchanged line.
As expected, the Fed left interest rates unchanged while the commentary pretty much remained the same as in “we’ll watch economic data” and “the timing of rate hikes is not as important as the pace and trajectory,” and so on. In other words, the Fed managed again to avoid any commitment other then that the policy will be still accommodative.
In the end, the market reaction was relatively muted due to unchanged policy theme and, as has been the mode of operation in the past, the food presented was pretty much the same as last time.
9 of our 10 ETFs in the Spotlight inched higher again led by Consumer Staples (XLP) with a 0.54% gain. Only the Financials (IYF) ended up slightly on the minus side by losing 0.09%.
2. ETFs in the Spotlight
In case you missed the announcement and description of this section, you can read it here again.
It features 10 broadly diversified ETFs from my HighVolume list as posted every Monday. Furthermore, they are screened for the lowest MaxDD% number meaning they have been showing better resistance to temporary sell offs than all others over the past year.
Here are the 10 candidates:
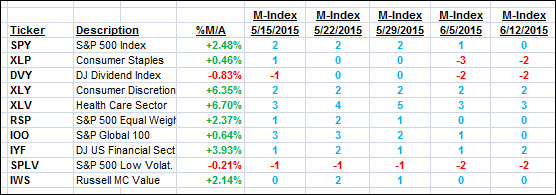
The above table simply demonstrates the magnitude with which some of the ETFs are fluctuating in regards to their positions above or below their respective individual trend lines (%M/A). A break below, represented by a negative number, shows weakness, while a break above, represented by a positive percentage, shows strength.
For hundreds of ETF/Mutual fund choices, be sure to reference Thursday’s StatSheet.
Year to date, here’s how the above candidates have fared so far:
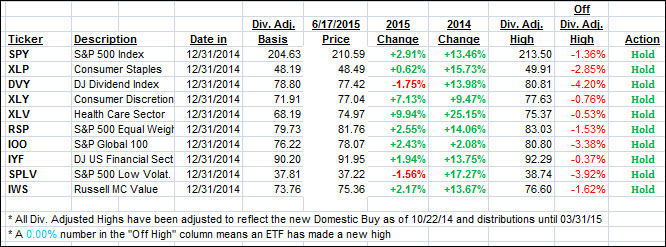
Again, the first table above shows the position of the various ETFs in relation to their respective long term trend lines (%M/A), while the second one tracks their trailing sell stops in the “Off High” column. The “Action” column will signal a “Sell” once the -7.5% point has been taken out in the “Off High” column.
3. Trend Tracking Indexes (TTIs)
Our Trend Tracking Indexes (TTIs) closed a tad higher ending the day as follows:
Domestic TTI: +1.87% (last close +1.72%)—Buy signal effective 10/22/2014
International TTI: +2.85% (last close +2.76%)—Buy signal effective 2/13/2015
Disclosure: I am obliged to inform you that I, as well as advisory clients of mine, own some of these listed ETFs. Furthermore, they do not represent a specific investment recommendation for you, they merely show which ETFs from the universe I track are falling within the guidelines specified.
Contact Ulli