

1. Moving the Markets
After yesterday’s downside debacle, it was only fitting to see some kind of a rebound attempt even though it was not nearly enough to make a dent in the losses the indexes sustained. It was nothing more than a “hope” rally with the latest news out of Greece being vague and non-inspiring to say the least.
The S&P 500 lost 2.1% for the month and ended its nine-quarter winning streak. While the index remains in the green year-to-date, the Dow on then other hand is in the red by 1.1%.
Greek news continues to dominate the headlines as Greece missed a $1.7 billion payment to the IMF, which was due today. On the menu is the scheduled referendum for July 5, with the population having the opportunity to make their voice heard in regards to Greece remaining in the eurozone. No matter what the outcome, it could be a wild upcoming week in the markets, so be prepared and know where your sell stops are and be ready to execute them should they be triggered.
With a predominately sideways pattern, 7 of our 10 ETFs in the Spotlight managed to inch up led by Consumer Discretionaries (XLY) sporting a 0.47% gain, while on the losing side the Global 100 (IOO) fared the worst by giving back another 0.33% on top of yesterday’s steep losses.
2. ETFs in the Spotlight
In case you missed the announcement and description of this section, you can read it here again.
It features 10 broadly diversified ETFs from my HighVolume list as posted every Monday. Furthermore, they are screened for the lowest MaxDD% number meaning they have been showing better resistance to temporary sell offs than all others over the past year.
Here are the 10 candidates:
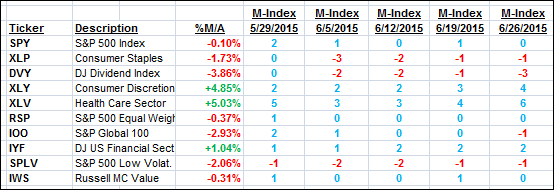
The above table simply demonstrates the magnitude with which some of the ETFs are fluctuating in regards to their positions above or below their respective individual trend lines (%M/A). A break below, represented by a negative number, shows weakness, while a break above, represented by a positive percentage, shows strength.
For hundreds of ETF/Mutual fund choices, be sure to reference Thursday’s StatSheet.
Year to date, here’s how the above candidates have fared so far:
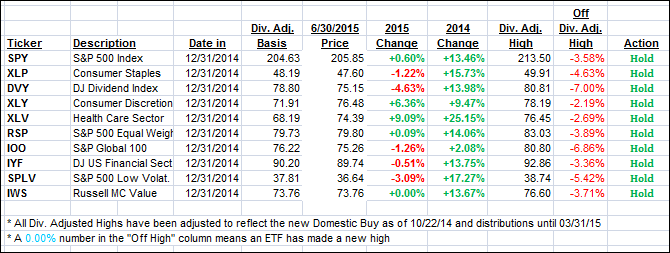
Again, the first table above shows the position of the various ETFs in relation to their respective long term trend lines (%M/A), while the second one tracks their trailing sell stops in the “Off High” column. The “Action” column will signal a “Sell” once the -7.5% point has been taken out in the “Off High” column.
3. Trend Tracking Indexes (TTIs)
Our Trend Tracking Indexes (TTIs) were mixed with the Domestic one gaining while the International one sank:
Domestic TTI: +0.80% (last close +0.74%)—Buy signal effective 10/22/2014
International TTI: +1.26% (last close +1.85%)—Buy signal effective 2/13/2015
Disclosure: I am obliged to inform you that I, as well as advisory clients of mine, own some of these listed ETFs. Furthermore, they do not represent a specific investment recommendation for you, they merely show which ETFs from the universe I track are falling within the guidelines specified.
Contact Ulli