
1. Moving the Markets
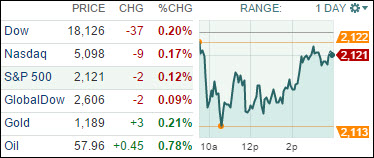
U.S. stocks closed lower today as uneasiness over a Greek debt deal and a selloff in Shanghai stocks weighed on investor sentiment. In China, stocks fell 6.5% on Thursday, with traders citing the tightening of marginal lending rules as a possible explanation. In economic news, jobless claims rose unexpectedly last week, but remained at levels consistent with a strengthening labor market. U.S. bonds finished mixed for the day.
In M&A news, Chipmaker Avago Technologies (AVGO) Thursday announced plans to buy rival Broadcom (BRCM) in a $37 billion cash and stock deal marking the latest consolidation of firms that supply parts for smartphones and other tech products. One of Avago’s representatives said today that, post-acquisition, the company will have the most diversified communications platform in the semiconductor industry that entails combined annual revenues of about $15 billion.
Moving on to the agricultural sector, we heard some news today that might come as a bit of a surprise to you. Apparently, Amazon (AMZN) is expanding the grocery business by broadening its private-label brand, Elements, into food items, according to a report by The Wall Street Journal. Amazon has apparently approached several food manufacturers to partner in the plans.
8 of our 10 ETFs in the Spotlight closed lower led by RSP with a small loss of 0.18%. Leading the upside was iShares Select Dividend (DVY) with a modest gain of 0.13%.
2. ETFs in the Spotlight
In case you missed the announcement and description of this section, you can read it here again.
It features 10 broadly diversified ETFs from my HighVolume list as posted every Monday. Furthermore, they are screened for the lowest MaxDD% number meaning they have been showing better resistance to temporary sell offs than all others over the past year.
Here are the 10 candidates:
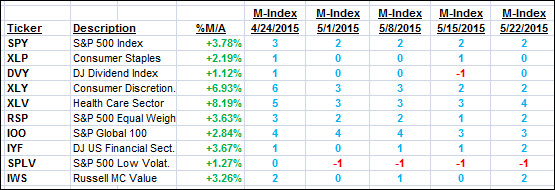
The above table simply demonstrates the magnitude with which some of the ETFs are fluctuating in regards to their positions above or below their respective individual trend lines (%M/A). A break below, represented by a negative number, shows weakness, while a break above, represented by a positive percentage, shows strength.
For hundreds of ETF/Mutual fund choices, be sure to reference Thursday’s StatSheet.
Year to date, here’s how the above candidates have fared so far:
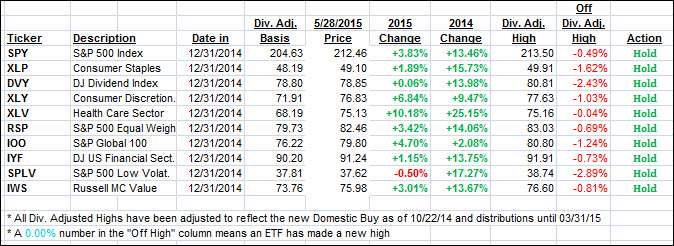
Again, the first table above shows the position of the various ETFs in relation to their respective long term trend lines (%M/A), while the second one tracks their trailing sell stops in the “Off High” column. The “Action” column will signal a “Sell” once the -7.5% point has been taken out in the “Off High” column.
3. Trend Tracking Indexes (TTIs)
Our Trend Tracking Indexes (TTIs) changed only slightly, as the major indexes remained directionless.
Here’s how we ended up:
Domestic TTI: +2.75% (last close +2.76%)—Buy signal effective 10/22/2014
International TTI: +4.78% (last close +4.97%)—Buy signal effective 2/13/2015
Disclosure: I am obliged to inform you that I, as well as advisory clients of mine, own some of these listed ETFs. Furthermore, they do not represent a specific investment recommendation for you, they merely show which ETFs from the universe I track are falling within the guidelines specified.
Contact Ulli
Comments 2
Hi Ulli. I’ve followed you for years and find your data and insight very valuable.
I’m puzzled over the difference between an ETF, VTI, and a mutual fund, VTSAX, which are both issued by the same company. Both are classified as Total Stock Market funds. VTI is about $109 a share and VTSAX is about $54.
They seem to have the same holdings and their price fluctuation graphs are near identical.
Why would the ETF cost twice as much as the mutual fund, assuming their holdings are the same?
I am also puzzled because each lists a p/e of 19. If the prices per share are so different and their holdings are the same, is this possible?
What are the financial disadvantages of buying the less expensive VTSAX? I realize the expense ratio difference and the capital gains distribution of VTSAX and the efficiency in trading ETFs. Is there any other major reason not to buy the mutual fund?
Thanks so much for any clarification.
Carlotta,
The price difference is merely a function of the provider (in this case Vanguard) deciding the price has gotten too high, since most investors prefer to buy something lower priced, and effect a stock split. At that time, the NAV would be halved and the number of shares you own would be doubled. There is no other reason for the difference that I know of.
Ulli…