
1. Moving the Markets
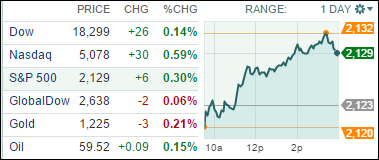
Stocks jumped in afternoon trading Monday as investors sent the Dow and S&P 500 up for a third straight session and to new record closing highs. The market’s latest rise is due in large part to the idea that an interest rate hike from the Federal Reserve is still due later this year, coupled with companies continuing to buy back their own shares and use cash to other acquire companies. For now though, it seems that Wall Street is simply relieved that a rate hike isn’t coming in June and first-quarter earnings didn’t contract as feared at the start of April.
In M&A news, Ascena Retail Group (ASNA) bought Ann Inc., the parent company of Ann Taylor and Loft retail chains, for about $2.16 billion. Shares of Ann (ANN) surged 19.9% and Ascena fell 1%. Also, in the pharma world, Endo International (ENDP) announced it is buying Par Pharmaceutical Holdings in an $8.05 billion deal to expand its generics business. Shares of Endo fell 5.4%.
As for the economy, U.S. economic reports were generally weaker than expected this week. Thus far in 2015, the pace of economic growth in the U.S. has gotten off to a soft start. Analysts expect the economy to regain momentum though as the year unfolds, and U.S. growth expectations remain above average when compared with developed economies around the globe. Regarding inflation, which seems to be on everyone’s mind lately, the producer price index posted a modest decline in April, excluding the often volatile food and energy components.
8 of our 10 ETFs in the Spotlight joined the upward move and closed on the plus side. The leader of the day were the financials (IYF) gaining 0.61%, while lagging the pack were consumer staples (XLP) with a loss of 0.32%.
2. ETFs in the Spotlight
In case you missed the announcement and description of this section, you can read it here again.
It features 10 broadly diversified ETFs from my HighVolume list as posted every Monday. Furthermore, they are screened for the lowest MaxDD% number meaning they have been showing better resistance to temporary sell offs than all others over the past year.
Here are the 10 candidates:
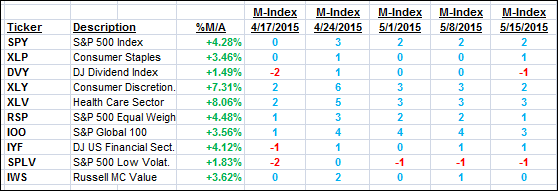
The above table simply demonstrates the magnitude with which some of the ETFs are fluctuating in regards to their positions above or below their respective individual trend lines (%M/A). A break below, represented by a negative number, shows weakness, while a break above, represented by a positive percentage, shows strength.
For hundreds of ETF/Mutual fund choices, be sure to reference Thursday’s StatSheet.
Year to date, here’s how the above candidates have fared so far:
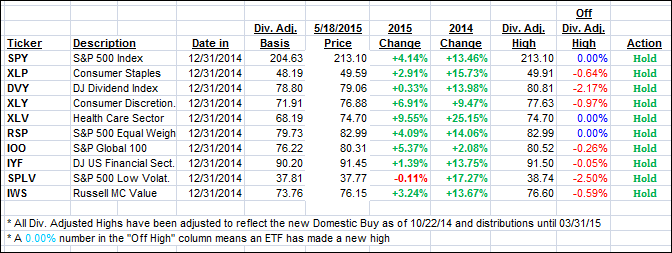
Again, the first table above shows the position of the various ETFs in relation to their respective long term trend lines (%M/A), while the second one tracks their trailing sell stops in the “Off High” column. The “Action” column will signal a “Sell” once the -7.5% point has been taken out in the “Off High” column.
3. Trend Tracking Indexes (TTIs)
Our Trend Tracking Indexes (TTIs) ended the day on a mixed note:
Domestic TTI: +2.90% (last close +2.85%)—Buy signal effective 10/22/2014
International TTI: +5.57% (last Friday +5.63%)—Buy signal effective 2/13/2015
Disclosure: I am obliged to inform you that I, as well as advisory clients of mine, own some of these listed ETFs. Furthermore, they do not represent a specific investment recommendation for you, they merely show which ETFs from the universe I track are falling within the guidelines specified.
Contact Ulli