
1. Moving the Markets
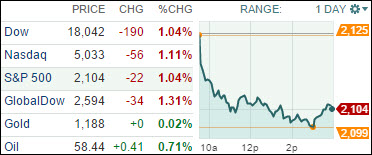
Well, I hope your holiday was enjoyable, because today was not for most investors. The Dow tumbled sharply and posted its worst day in May as a stronger U.S. dollar and mixed economic data rattled investors. The downturn was broad-based as all 10 of the S&P 500 sectors were lower and all 30 Dow stocks dropped.
In M&A news, Charter Communications (CHTR) said today that it is buying Time Warner Cable (TWC) for $55.3 billion, forging ahead with its theory that broadening its presence nationally would provide the leverage it needs to fend off the challenges in the turbulent pay-TV industry. After completing the deal, Charter will have about 27 million customers in 41 states, trailing only Comcast (CCV). Charter will pay $195.71 per share in the cash-and-stock deal — $100 of it in cash with the rest in Charter shares. The offer is based on Charter’s 60-trading day volume weighted average price.
In economic news, a manufacturing report provided mixed data as orders for durable goods orders dropped 0.5% in April but orders in the key business investment category gained 1%. Also, the housing market continued to show signs of improvement as home prices rose faster than expected in March and new home sales in April rose 6.8%.
All of our 10 ETFs in the Spotlight headed down that slippery slope and closed lower. The Global 100 (IOO) showed the worst performance with a loss of 1.63%, while Consumer Discretionaries (XLY) held up best by giving back only 0.71%.
2. ETFs in the Spotlight
In case you missed the announcement and description of this section, you can read it here again.
It features 10 broadly diversified ETFs from my HighVolume list as posted every Monday. Furthermore, they are screened for the lowest MaxDD% number meaning they have been showing better resistance to temporary sell offs than all others over the past year.
Here are the 10 candidates:
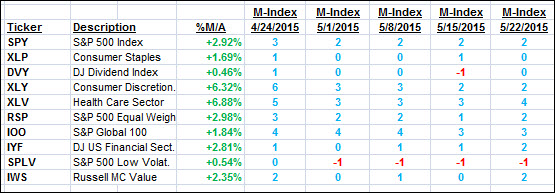
The above table simply demonstrates the magnitude with which some of the ETFs are fluctuating in regards to their positions above or below their respective individual trend lines (%M/A). A break below, represented by a negative number, shows weakness, while a break above, represented by a positive percentage, shows strength.
For hundreds of ETF/Mutual fund choices, be sure to reference Thursday’s StatSheet.
Year to date, here’s how the above candidates have fared so far:
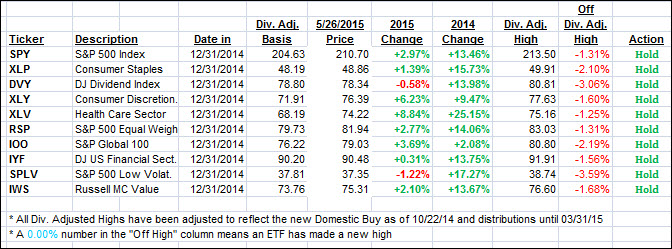
Again, the first table above shows the position of the various ETFs in relation to their respective long term trend lines (%M/A), while the second one tracks their trailing sell stops in the “Off High” column. The “Action” column will signal a “Sell” once the -7.5% point has been taken out in the “Off High” column.
3. Trend Tracking Indexes (TTIs)
Our Trend Tracking Indexes (TTIs) dropped but remain on the bullish side of their respective trend lines:
Domestic TTI: +2.30% (last close +2.77%)—Buy signal effective 10/22/2014
International TTI: +4.19% (last close +5.25%)—Buy signal effective 2/13/2015
Disclosure: I am obliged to inform you that I, as well as advisory clients of mine, own some of these listed ETFs. Furthermore, they do not represent a specific investment recommendation for you, they merely show which ETFs from the universe I track are falling within the guidelines specified.
Contact Ulli