
1. Moving the Markets
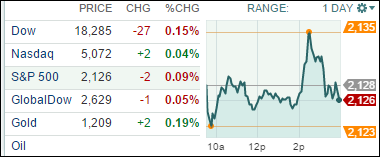
Stocks ended mixed after a short-lived bump, caused by the release of the minutes from the last Federal Reserve meeting, which showed a June rate hike was unlikely. Federal Reserve policymakers said last month that they were unlikely to raise interest rates in June because of the economy’s recent sluggish performance, according to minutes of the Fed’s April 28-29 meeting. Since the April meeting, reports on trade and retail sales have been surprisingly weak, and economists now estimate the economy shrank in the first quarter, further reducing the prospects for a June rate increase
Flying back to the world of airline stocks, shares of airline companies have been taking a hit across the board recently due to speculation that airlines are going to expand capacity, which could lead to lower fares and lower revenue per available seat mile. This may be a case where growth may not be in the best interest of shareholders. It will be interesting to see how this unfolds in the months to come.
In earnings news, we heard today that Salesforce (CRM) reported slightly better-than-expected quarterly earnings and revenue as its cloud computing segments rose year over year. At the same time, Salesforce raised its full-year revenue guidance to a range of $6.52 billion to $6.55 billion, which would mark an increase of more than 20 percent from the previous year.
Again, 3 of our 10 ETFs in the Spotlight gained on the day with the leader being the Global 100 (IOO), which added 0.37%, while on the downside the Financials (IYF) gave back 0.33%.
2. ETFs in the Spotlight
In case you missed the announcement and description of this section, you can read it here again.
It features 10 broadly diversified ETFs from my HighVolume list as posted every Monday. Furthermore, they are screened for the lowest MaxDD% number meaning they have been showing better resistance to temporary sell offs than all others over the past year.
Here are the 10 candidates:
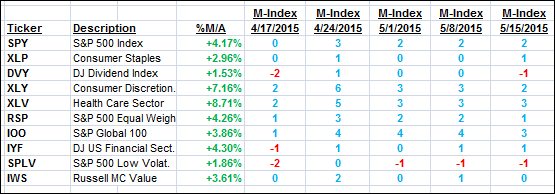
The above table simply demonstrates the magnitude with which some of the ETFs are fluctuating in regards to their positions above or below their respective individual trend lines (%M/A). A break below, represented by a negative number, shows weakness, while a break above, represented by a positive percentage, shows strength.
For hundreds of ETF/Mutual fund choices, be sure to reference Thursday’s StatSheet.
Year to date, here’s how the above candidates have fared so far:
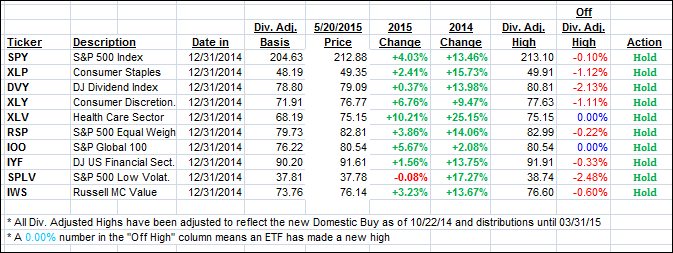
Again, the first table above shows the position of the various ETFs in relation to their respective long term trend lines (%M/A), while the second one tracks their trailing sell stops in the “Off High” column. The “Action” column will signal a “Sell” once the -7.5% point has been taken out in the “Off High” column.
3. Trend Tracking Indexes (TTIs)
Our Trend Tracking Indexes (TTIs) changed only immaterially:
Domestic TTI: +2.84% (last close +2.80%)—Buy signal effective 10/22/2014
International TTI: +5.49% (last Friday +5.47%)—Buy signal effective 2/13/2015
Disclosure: I am obliged to inform you that I, as well as advisory clients of mine, own some of these listed ETFs. Furthermore, they do not represent a specific investment recommendation for you, they merely show which ETFs from the universe I track are falling within the guidelines specified.
Contact Ulli