

1. Moving the Markets
Stocks rallied after three straight days of losses for the S&P 500 and Dow, which on Thursday logged a new closing high and jumped nearly 200 points.
In market movers today, Facebook (FB) climbed 3.7%. The jump added to a 1.3% gain yesterday after the company reached a deal with New York Times and eight other media outlets to post stories directly to the social network’s mobile news feed.
Energy companies in the Dow were little changed as oil prices retreated. Transocean Ltd. and Noble Corp. lost more than 2.7%, while Tesoro Corp. and Valero Energy Corp. gained at least 2.5%.
In economic news, producer prices fell 0.4% in April on a sharp drop in food and gasoline costs, the Labor Department reported. Core prices at the wholesale level, excluding the volatile food and energy categories, fell 0.2%. Also, jobless claims decreased to 264,000, below the 273,000. On the currency side, the U.S. dollar, which had been trending sharply higher heading into April, continued to weaken vs. the euro. The euro climbed to 1.14 vs. the dollar, a three-month high.
All of our 10 ETFs in the Spotlight participated in today’s bullish move as consumer staples (XLP) took the lead with a 1.54% gain; lagging the group were consumer discretionaries (XLY), which added 0.45%. Even SPLV showed signs of life by jumping 1.43%.
2. ETFs in the Spotlight
In case you missed the announcement and description of this section, you can read it here again.
It features 10 broadly diversified ETFs from my HighVolume list as posted every Monday. Furthermore, they are screened for the lowest MaxDD% number meaning they have been showing better resistance to temporary sell offs than all others over the past year.
Here are the 10 candidates:
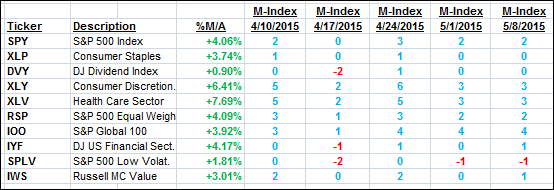
The above table simply demonstrates the magnitude with which some of the ETFs are fluctuating in regards to their positions above or below their respective individual trend lines (%M/A). A break below, represented by a negative number, shows weakness, while a break above, represented by a positive percentage, shows strength.
For hundreds of ETF/Mutual fund choices, be sure to reference Thursday’s StatSheet.
Year to date, here’s how the above candidates have fared so far:
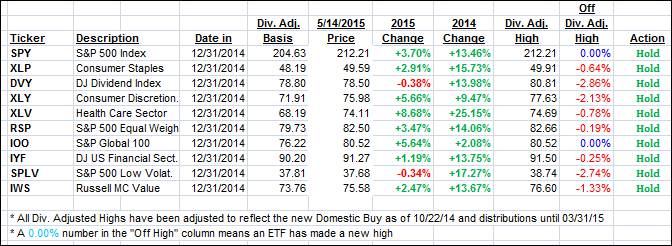
Again, the first table above shows the position of the various ETFs in relation to their respective long term trend lines (%M/A), while the second one tracks their trailing sell stops in the “Off High” column. The “Action” column will signal a “Sell” once the -7.5% point has been taken out in the “Off High” column.
3. Trend Tracking Indexes (TTIs)
Our Trend Tracking Indexes (TTIs) joined the bullish party and jumped to close as follows:
Domestic TTI: +2.90% (last close +2.16%)—Buy signal effective 10/22/2014
International TTI: +5.69% (last close +4.84%)—Buy signal effective 2/13/2015
Disclosure: I am obliged to inform you that I, as well as advisory clients of mine, own some of these listed ETFs. Furthermore, they do not represent a specific investment recommendation for you, they merely show which ETFs from the universe I track are falling within the guidelines specified.
Contact Ulli