
1. Moving the Markets
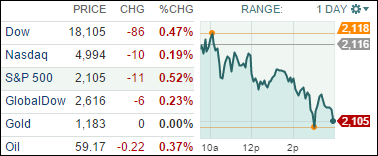
Stocks fell as Wall Street failed to extend Friday’s strong jobs-fueled rally, and a drop in oil prices helped push energy stocks sharply lower. U.S. benchmark crude fell 26 cents to $59.13 a barrel and shares of ExxonMobil (XOM) dropped 1.7% and Chevron (CVX) fell 1.2% accordingly.
In M&A news, today we saw shares of Rosetta Resources (ROSE) surge 27.2% after Noble Energy (NBL) said it was buying the oil and gas exploration company for about $2.1 billion in stock. Noble’s stock fell 6.2% though.
In scandalous news, Citigroup (C) confirmed Monday that it could plead guilty to an antitrust charge as part of a settlement with the Department of Justice over evidence that traders of the U.S.-based global bank manipulated foreign-exchange currency rates. The stock dropped ever so slightly today by 0.09%.
And in international news, China was back in focus today. The country’s administration cut interest rates again on Sunday, which marks the third time in six months. Investors are worried that the interest rate cut may not be enough to stimulate an economy that is headed for its worst year in a quarter of a century.
9 of our 10 ETFs in the Spotlight slipped as the market lost Friday’s upward momentum. Leading to the downside was SPLV, which gave back 0.72%. The lonely winner was healthcare (XLV) with a small 0.05% gain.
2. ETFs in the Spotlight
In case you missed the announcement and description of this section, you can read it here again.
It features 10 broadly diversified ETFs from my HighVolume list as posted every Monday. Furthermore, they are screened for the lowest MaxDD% number meaning they have been showing better resistance to temporary sell offs than all others over the past year.
Here are the 10 candidates:
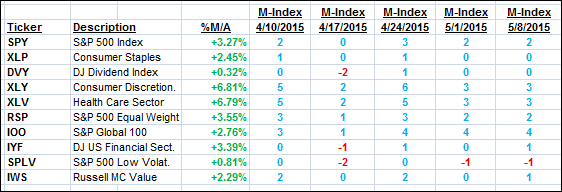
The above table simply demonstrates the magnitude with which some of the ETFs are fluctuating in regards to their positions above or below their respective individual trend lines (%M/A). A break below, represented by a negative number, shows weakness, while a break above, represented by a positive percentage, shows strength.
For hundreds of ETF/Mutual fund choices, be sure to reference Thursday’s StatSheet.
Year to date, here’s how the above candidates have fared so far:
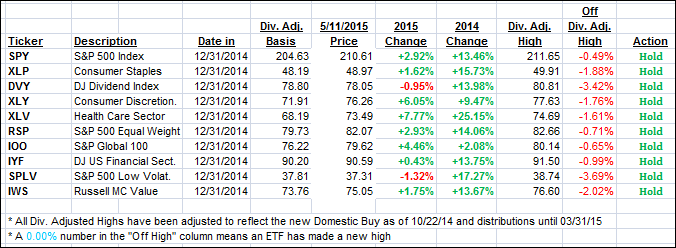
Again, the first table above shows the position of the various ETFs in relation to their respective long term trend lines (%M/A), while the second one tracks their trailing sell stops in the “Off High” column. The “Action” column will signal a “Sell” once the -7.5% point has been taken out in the “Off High” column.
3. Trend Tracking Indexes (TTIs)
Our Trend Tracking Indexes (TTIs) retreated after Friday’s strong rally.
Here’s how we ended up:
Domestic TTI: +2.18% (last close +2.54%)—Buy signal effective 10/22/2014
International TTI: +4.80% (last close +5.07%)—Buy signal effective 2/13/2015
Disclosure: I am obliged to inform you that I, as well as advisory clients of mine, own some of these listed ETFs. Furthermore, they do not represent a specific investment recommendation for you, they merely show which ETFs from the universe I track are falling within the guidelines specified.
Contact Ulli