
1. Moving the Markets
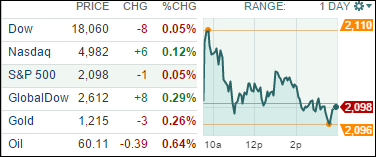
The major indexes fluctuated throughout the day, but there was no conviction in either direction, so the S&P 500 ended down a scant 0.05%. Same with the Dow, however, the Nasdaq managed to edge into plus territory by a meager 0.12%.
The early rally did not hold, and we spend the remainder of the session trying to stay above the unchanged line. Monthly retail sales figure were disappointing with the positive spin being that the Fed might delay any interest hikes due to the economy lacking spunk.
In the end, the tug-of-war between bulls and bears may very well continue until some momentum shift will push the indexes out of their current range bound patterns.
4 of our 10 ETFs in the Spotlight managed to eke out a gain with the leader being healthcare (XLV) with 0.11%, while the downside was led by Consumer Discretionaries (XLY) with a 0.63% loss.
2. ETFs in the Spotlight
In case you missed the announcement and description of this section, you can read it here again.
It features 10 broadly diversified ETFs from my HighVolume list as posted every Monday. Furthermore, they are screened for the lowest MaxDD% number meaning they have been showing better resistance to temporary sell offs than all others over the past year.
Here are the 10 candidates:
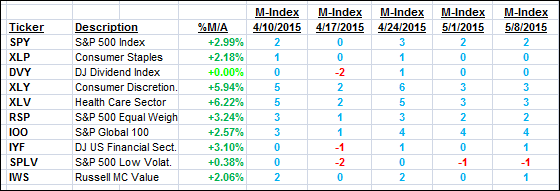
The above table simply demonstrates the magnitude with which some of the ETFs are fluctuating in regards to their positions above or below their respective individual trend lines (%M/A). A break below, represented by a negative number, shows weakness, while a break above, represented by a positive percentage, shows strength.
For hundreds of ETF/Mutual fund choices, be sure to reference Thursday’s StatSheet.
Year to date, here’s how the above candidates have fared so far:
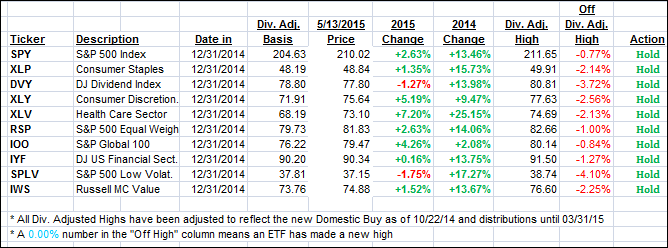
Again, the first table above shows the position of the various ETFs in relation to their respective long term trend lines (%M/A), while the second one tracks their trailing sell stops in the “Off High” column. The “Action” column will signal a “Sell” once the -7.5% point has been taken out in the “Off High” column.
3. Trend Tracking Indexes (TTIs)
Our Trend Tracking Indexes (TTIs) edged up a bit and remain in bullish territory by the following percentages:
Domestic TTI: +2.16% (last close +2.09%)—Buy signal effective 10/22/2014
International TTI: +4.84% (last close +4.45%)—Buy signal effective 2/13/2015
Disclosure: I am obliged to inform you that I, as well as advisory clients of mine, own some of these listed ETFs. Furthermore, they do not represent a specific investment recommendation for you, they merely show which ETFs from the universe I track are falling within the guidelines specified.
Contact Ulli