
1. Moving the Markets
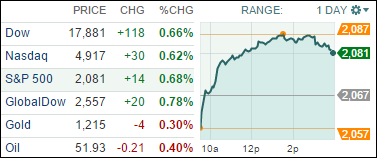
Wall Street seemed to ignore the lackluster jobs report that was released Friday when the stock market was closed for Easter. Since bad news is good news these days, equities pushed sharply higher today amid a growing sense that the Fed will push back its first rate hike to sometime in Q3 or later. Gains were led by the energy and utilities sectors as oil prices jumped $2.55.
Tesla (TSLA) took investors for a ride today following news late Friday that the company’s vehicle shipments for Q1 were 5% better than expected. Investors still remain bearish on the stock for the most part due to the fact that it remains below its 200-day moving average.
Those bullish on USD currency may not be so happy today. The dollar fell a fourth day, which is the longest streak of depreciation in nine months. The beloved greenback slipped as a Fed measure of conditions in the labor market slumped.
In more positive economic news, small-business hiring is picking up and could account for most new jobs this year as large companies pull back amid global economic troubles. The NFIB says small businesses added an average 0.18 workers per firm in March, which is one of the best readings in the last decade. Also, small-business credit providers are opening wider. According to Biz2Credit, big banks approved 21.5% of small-business loan requests in February, a post-recession high.
All of our 10 ETFs in the Spotlight edged up with IOO being the front runner sporting a gain of +1.20%, while healthcare (XLV) was lagging the group with +0.15%.
2. ETFs in the Spotlight
In case you missed the announcement and description of this section, you can read it here again.
It features 10 broadly diversified ETFs from my HighVolume list as posted every Monday. Furthermore, they are screened for the lowest MaxDD% number meaning they have been showing better resistance to temporary sell offs than all others over the past year.
Here are the 10 candidates:
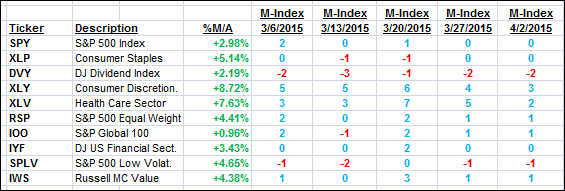
The above table simply demonstrates the magnitude with which some of the ETFs are fluctuating in regards to their positions above or below their respective individual trend lines (%M/A). A break below, represented by a negative number, shows weakness, while a break above, represented by a positive percentage, shows strength.
For hundreds of ETF/Mutual fund choices, be sure to reference Thursday’s StatSheet.
Year to date, here’s how the above candidates have fared so far:
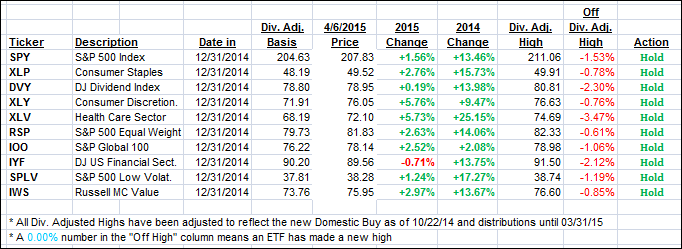
Again, the first table above shows the position of the various ETFs in relation to their respective long term trend lines (%M/A), while the second one tracks their trailing sell stops in the “Off High” column. The “Action” column will signal a “Sell” once the -7.5% point has been taken out in the “Off High” column.
3. Trend Tracking Indexes (TTIs)
Our Trend Tracking Indexes (TTIs) moved deeper into bullish territory, although European markets were closed due to the extened Easter Holdiay.
Here’s how we closed:
Domestic TTI: +3.12% (last close +2.74%)—Buy signal effective 10/22/2014
International TTI: +4.37% (last Friday +3.83%)—Buy signal effective 2/13/2015
Disclosure: I am obliged to inform you that I, as well as advisory clients of mine, own some of these listed ETFs. Furthermore, they do not represent a specific investment recommendation for you, they merely show which ETFs from the universe I track are falling within the guidelines specified.
Contact Ulli