
1. Moving the Markets
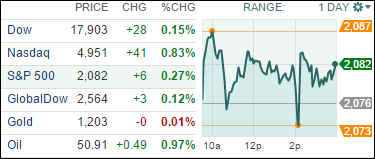
Stocks ended up higher after the release of minutes from the Fed’s meeting in March showed policymakers were divided on the timing of the first interest rate hike. The report remained consistent, however, with Fed policymakers’ forecasts that indicate the first hike in rates since 2006 is unlikely to take place before September.
Energy stocks and the oil were in focus today as oil prices slid on a build-up in U.S. inventories and a $70 billion oil merger was announced. U.S. benchmark crude fell 6% to close at $50.42 a barrel in New York after the Energy Information Administration reported a larger-than-expected increase in oil stockpiles last week. Chevron (CVX) dropped 1.7% and ExxonMobil (XOM) fell 2%.
In one of the largest corporate deals of the year, Royal Dutch Shell (RDS.A) agreed to buy Britain’s BG Group (BRGYY) for $70 billion in cash and stock. It is set to be one of the largest corporate deals of the year.
And earnings season began today with Alcoa (AA) reporting after the closing bell. Earnings beat estimates, but revenue was a shortfall. Wall Street analysts remain bearish on Q1 earnings and expect profits for S&P 500 companies to contract 2.8%.
8 of our 10 ETFs in the Spotlight manage to close up in this non-directional day. Consumer Discretionaries (XLY) was the winner with a gain of +0.94%, which was closely followed by Healthcare (XLV) with +0.84%. On the downside, DVY led with a modest loss of -0.19%.
2. ETFs in the Spotlight
In case you missed the announcement and description of this section, you can read it here again.
It features 10 broadly diversified ETFs from my HighVolume list as posted every Monday. Furthermore, they are screened for the lowest MaxDD% number meaning they have been showing better resistance to temporary sell offs than all others over the past year.
Here are the 10 candidates:
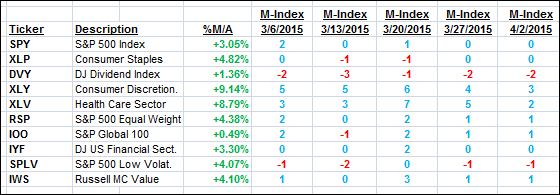
The above table simply demonstrates the magnitude with which some of the ETFs are fluctuating in regards to their positions above or below their respective individual trend lines (%M/A). A break below, represented by a negative number, shows weakness, while a break above, represented by a positive percentage, shows strength.
For hundreds of ETF/Mutual fund choices, be sure to reference Thursday’s StatSheet.
Year to date, here’s how the above candidates have fared so far:
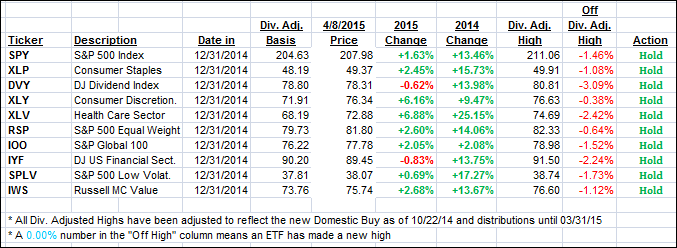
Again, the first table above shows the position of the various ETFs in relation to their respective long term trend lines (%M/A), while the second one tracks their trailing sell stops in the “Off High” column. The “Action” column will signal a “Sell” once the -7.5% point has been taken out in the “Off High” column.
3. Trend Tracking Indexes (TTIs)
Our Trend Tracking Indexes (TTIs) edged a tad higher during this roller coaster type of a trading day.
Here’s how we closed:
Domestic TTI: +3.17% (last close +2.99%)—Buy signal effective 10/22/2014
International TTI: +4.62% (last close +4.39%)—Buy signal effective 2/13/2015
Disclosure: I am obliged to inform you that I, as well as advisory clients of mine, own some of these listed ETFs. Furthermore, they do not represent a specific investment recommendation for you, they merely show which ETFs from the universe I track are falling within the guidelines specified.
Contact Ulli