
1. Moving the Markets
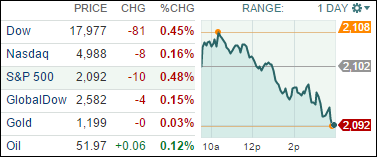
Equities fell as investors look ahead to a busy week of earnings and economic data. The stock market is coming off its second straight week of gains, and its next move will be determined largely by what corporate CEOs say about the earnings outlook for the rest of 2015.
Remember that a sluggish winter, dropping oil prices and a rising dollar have taken their toll on the economy and earnings in the quarter of 2015. Wall Street is expecting the S&P 500 to post its first contraction in quarterly earnings in almost six years when first-quarter profit reports are all tallied up.
We heard great news from the credit ratings industry today. Fitch Ratings – one of the largest providers of credit ratings for debt – affirmed the AAA rating for the USA Monday. The rating is extremely important with bond investors, who aren’t just concerned about a creditor’s current financial situation, but more importantly, how it looks in the future.
We will see a notable amount of earnings this week. In banking, Wells Fargo (WFC) and JPMorgan Chase (JPM) will start things off on Tuesday. A few techs have reported March-quarter results, but the season really kicks off with Intel (INTC) after the market close Tuesday. The No. 1 chipmaker is expected to post EPS of 41 cents, up 8% and revenue is expected to inch up 1% to $12.9 billion.
And in international news, we saw data today that showed trade in China shrank more than expected in March, with imports down 12.7% from a year earlier and exports falling 15%. The numbers fueled concern that economic data due out Wednesday will show overall growth fell further in the first three months of 2015 after declining to 7.3% in the final quarter of last year.
Only 1 of our 10 ETFs in the Spotlight, namely IYF, managed to buck the trend by adding +0.23%; all others ended up in the red with DVY showing the most weakness with a -0.66% loss.
2. ETFs in the Spotlight
In case you missed the announcement and description of this section, you can read it here again.
It features 10 broadly diversified ETFs from my HighVolume list as posted every Monday. Furthermore, they are screened for the lowest MaxDD% number meaning they have been showing better resistance to temporary sell offs than all others over the past year.
Here are the 10 candidates:
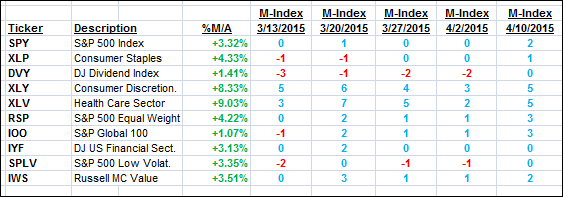
The above table simply demonstrates the magnitude with which some of the ETFs are fluctuating in regards to their positions above or below their respective individual trend lines (%M/A). A break below, represented by a negative number, shows weakness, while a break above, represented by a positive percentage, shows strength.
For hundreds of ETF/Mutual fund choices, be sure to reference Thursday’s StatSheet.
Year to date, here’s how the above candidates have fared so far:
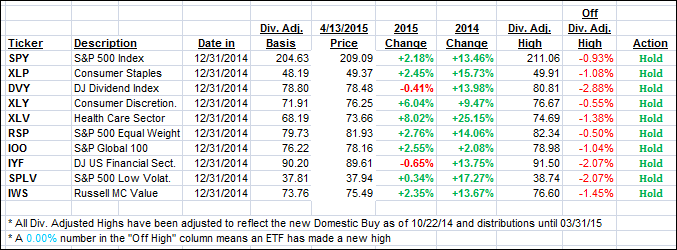
Again, the first table above shows the position of the various ETFs in relation to their respective long term trend lines (%M/A), while the second one tracks their trailing sell stops in the “Off High” column. The “Action” column will signal a “Sell” once the -7.5% point has been taken out in the “Off High” column.
3. Trend Tracking Indexes (TTIs)
Our Trend Tracking Indexes (TTIs) closed down but still remain firmly entrenched on the bullish side of their respective trend lines.
Here’s how we closed:
Domestic TTI: +3.18% (last close +3.31%)—Buy signal effective 10/22/2014
International TTI: +4.62% (last close +4.95%)—Buy signal effective 2/13/2015
Disclosure: I am obliged to inform you that I, as well as advisory clients of mine, own some of these listed ETFs. Furthermore, they do not represent a specific investment recommendation for you, they merely show which ETFs from the universe I track are falling within the guidelines specified.
Contact Ulli