
1. Moving the Markets
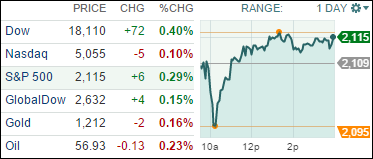
Stocks cut early losses and closed mostly higher as the Federal Reserve began a two-day policy meeting to discuss the economy and interest rates. The Nasdaq was the only major index that closed in the red, down 0.10%.
As you know, interest rates have been at the forefront of news headlines for the past year. However, it still seems that most economists believe there’s virtually no chance the Fed will hike rates Wednesday after stating last month that an April move was unlikely. But investors will be scouring the central bank’s post-meeting statement though for clues as to whether a June liftoff remains a possibility.
In earnings news, you may want to “tweet” this bit of info. Shares of the social media company Twitter (TWTR) plunged after it reported first-quarter revenue far below Wall Street estimates and issued a disappointing outlook for the current quarter and for the rest of the year. Twitter reported a loss of $162 million, or 25 cents a share, compared with a loss of $132 million, or 23 cents a share a year ago. Shares of Twitter fell as much as 20% and closed down 18% to $42.27.
In other economic news, stocks fell early in the trading session after it was reported that consumer confidence unexpectedly tumbled in April. We also saw disappointing job growth numbers and continued. We did hear some positive news though on the housing front. Home prices climbed at a faster pace in February than the previous month, driven by higher sales and a limited supply of available houses.
In a reversal from yesterday, 9 of our 10 ETFs in the Spotlight headed higher with DVY showing the best gain at 0.58%, while XLY ended up in the red with a loss of 0.35%.
2. ETFs in the Spotlight
In case you missed the announcement and description of this section, you can read it here again.
It features 10 broadly diversified ETFs from my HighVolume list as posted every Monday. Furthermore, they are screened for the lowest MaxDD% number meaning they have been showing better resistance to temporary sell offs than all others over the past year.
Here are the 10 candidates:
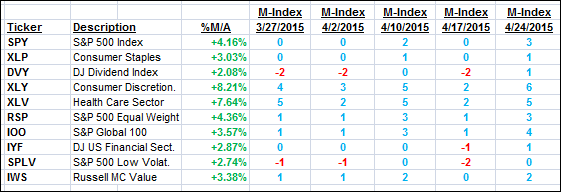
The above table simply demonstrates the magnitude with which some of the ETFs are fluctuating in regards to their positions above or below their respective individual trend lines (%M/A). A break below, represented by a negative number, shows weakness, while a break above, represented by a positive percentage, shows strength.
For hundreds of ETF/Mutual fund choices, be sure to reference Thursday’s StatSheet.
Year to date, here’s how the above candidates have fared so far:
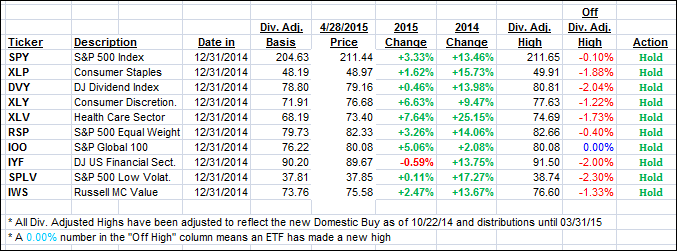
Again, the first table above shows the position of the various ETFs in relation to their respective long term trend lines (%M/A), while the second one tracks their trailing sell stops in the “Off High” column. The “Action” column will signal a “Sell” once the -7.5% point has been taken out in the “Off High” column.
3. Trend Tracking Indexes (TTIs)
Our Trend Tracking Indexes (TTIs) slipped a bit but remain solidly on the bullish side of their respective trend lines.
Here’s how we ended up:
Domestic TTI: +3.25% (last close +3.36%)—Buy signal effective 10/22/2014
International TTI: +5.30% (last close +5.58%)—Buy signal effective 2/13/2015
Disclosure: I am obliged to inform you that I, as well as advisory clients of mine, own some of these listed ETFs. Furthermore, they do not represent a specific investment recommendation for you, they merely show which ETFs from the universe I track are falling within the guidelines specified.
Contact Ulli