
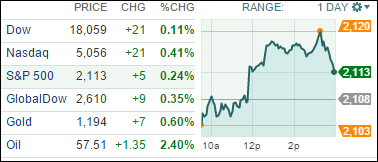
1. Moving the Markets
The previous record high (5,048.62), which dates back to March 10, 2000 at the prime time height of the dot-com bubble, was surpassed today by about 12 points. What does the new record high mean exactly? Well, in the simplest sense it means that the Nasdaq has finally completely recovered 15 years later.
In general earnings news, Procter & Gamble (PG) and 3M (MMM) both fell after earnings missed expectations due to a strong dollar hurting global sales. In more enticing earnings news, Starbucks (SBUX) captured headlines today when the company posted record Q2 revenues just after the closing bell. The Q2 revenues were $4.6 bil and the bottom line was reported earnings per share of 33 cents — up 18% from the same period a year ago. As a side note, the company also reported that it opened 210 new stores in the second quarter, bringing the total stores worldwide to 22,088.
As for M&A, it was rumored today that Comcast Corp. is preparing to announce that it will abandon its attempt to buy Time Warner Cable (TWC), according to Bloomberg News. Given the size of the potential transaction ($45 billion) there has obviously been a notable level of federal involvement, which seems to have become a major headache and impediment for Comcast to move forward with the transaction.
There was not much to report in economic news, except that we received a batch of data that turned out to be weaker than estimated…notably that jobless claims rose and new home sales fell in March.
9 our 10 ETFs in the Spotlight closed on the plus side, as XLY (consumer discretionaries) took the lead with +0.50%, while XLP (consumer staples) was the lone loser with -0.34%.
2. ETFs in the Spotlight
In case you missed the announcement and description of this section, you can read it here again.
It features 10 broadly diversified ETFs from my HighVolume list as posted every Monday. Furthermore, they are screened for the lowest MaxDD% number meaning they have been showing better resistance to temporary sell offs than all others over the past year.
Here are the 10 candidates:
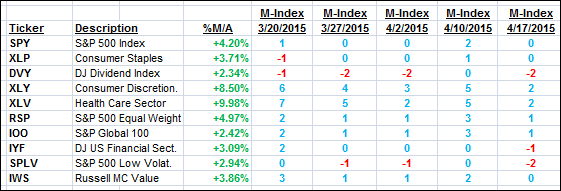
The above table simply demonstrates the magnitude with which some of the ETFs are fluctuating in regards to their positions above or below their respective individual trend lines (%M/A). A break below, represented by a negative number, shows weakness, while a break above, represented by a positive percentage, shows strength.
For hundreds of ETF/Mutual fund choices, be sure to reference Thursday’s StatSheet.
Year to date, here’s how the above candidates have fared so far:
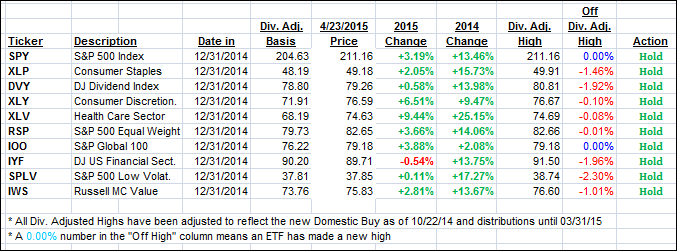
Again, the first table above shows the position of the various ETFs in relation to their respective long term trend lines (%M/A), while the second one tracks their trailing sell stops in the “Off High” column. The “Action” column will signal a “Sell” once the -7.5% point has been taken out in the “Off High” column.
3. Trend Tracking Indexes (TTIs)
Our Trend Tracking Indexes (TTIs) again joined upward momentum and closed higher ending the day as follows:
Domestic TTI: +3.69% (last close +3.45%)—Buy signal effective 10/22/2014
International TTI: +5.36% (last close +5.00%)—Buy signal effective 2/13/2015
Disclosure: I am obliged to inform you that I, as well as advisory clients of mine, own some of these listed ETFs. Furthermore, they do not represent a specific investment recommendation for you, they merely show which ETFs from the universe I track are falling within the guidelines specified.
Contact Ulli