
1. Moving the Markets
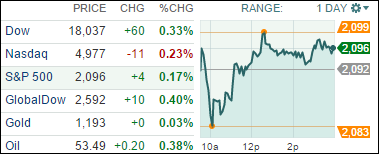
The major indexes closed mixed as energy stocks rallied on higher oil prices, which tech stocks lagged. The Dow moved back above 18,000, but there was no real momentum of note in trading today.
Wells Fargo (WFC) reported that first-quarter earnings fell to $5.8 billion, or $1.04 per share. The results beat analysts’ estimates of 98 cents per share, but the stock still fell 0.7%. Dow component Johnson & Johnson’s (JNJ) reported that quarterly profits fell 8.6%, mostly due to unfavorable exchange rates, a major divestiture and competition to its new hepatitis C drug. Shares didn’t take much of a hit though, only dipping 0.03%.
As for more upbeat news, retail sales rose in March, which marks the first monthly increase since November. Analysts cited stronger auto sales as the main force driving retail sales higher. Also, we heard today that American consumers’ increased spending boosted retail sales by a seasonally adjusted 0.9% in February.
In M&A news, there was a rumor today that Finnish phone-maker Nokia (NOK) is in talks to buy Alcatel-Lucent (ALU). If the acquisition goes through, it would undoubtedly create a new global telecom giant. So, keep your eyes peeled for more news about the deal.
9 of our 10 ETFs in the Spotlight recovered with the indexes and closed up; the leader was DVY with a gain of +0.57%. On the downside, XLY slipped a scant -0.05%.
2. ETFs in the Spotlight
In case you missed the announcement and description of this section, you can read it here again.
It features 10 broadly diversified ETFs from my HighVolume list as posted every Monday. Furthermore, they are screened for the lowest MaxDD% number meaning they have been showing better resistance to temporary sell offs than all others over the past year.
Here are the 10 candidates:
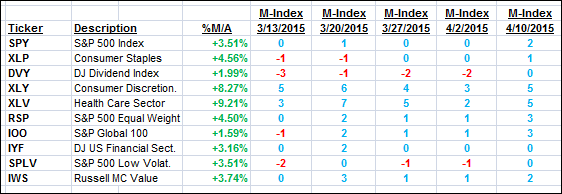
The above table simply demonstrates the magnitude with which some of the ETFs are fluctuating in regards to their positions above or below their respective individual trend lines (%M/A). A break below, represented by a negative number, shows weakness, while a break above, represented by a positive percentage, shows strength.
For hundreds of ETF/Mutual fund choices, be sure to reference Thursday’s StatSheet.
Year to date, here’s how the above candidates have fared so far:
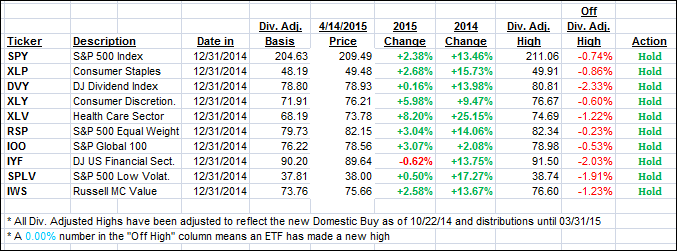
Again, the first table above shows the position of the various ETFs in relation to their respective long term trend lines (%M/A), while the second one tracks their trailing sell stops in the “Off High” column. The “Action” column will signal a “Sell” once the -7.5% point has been taken out in the “Off High” column.
3. Trend Tracking Indexes (TTIs)
Our Trend Tracking Indexes (TTIs) inched up a tad as the markets predominantly traded in a sideways pattern.
Here’s how we ended up:
Domestic TTI: +3.27% (last close +3.18%)—Buy signal effective 10/22/2014
International TTI: +4.78% (last close +4.62%)—Buy signal effective 2/13/2015
Disclosure: I am obliged to inform you that I, as well as advisory clients of mine, own some of these listed ETFs. Furthermore, they do not represent a specific investment recommendation for you, they merely show which ETFs from the universe I track are falling within the guidelines specified.
Contact Ulli