
1. Moving the Markets
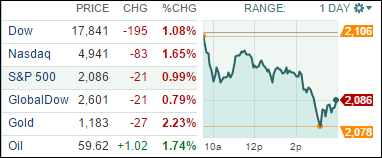
Stocks ended the month on a weak note as traders reacted to new information, ranging from a suddenly weakening dollar vs. the euro and strong incoming U.S. data that raised fresh fears about interest rate hikes.
We heard some solid economic data released today, including a better-than-expected reading on manufacturing in the Chicago region and a bigger-than-expected rise in employment costs, which could be signaling that the first-quarter soft patch may, in fact, be transitory, as the Federal Reserve suggested in its policy statement yesterday. Stocks fell for a second straight day after Wednesday’s news of anemic GDP growth of 0.2% in the first quarter, and the Fed’s announcement that showed policymakers are still grappling with when to begin raising interest rates but indicated they could hike rates at any meeting.
In earnings news, ExxonMobil (XOM) earnings fell 46% on lower oil prices and revenue. On the flipside, the company announced a 9.5% dividend increase. The stock fell 0.6%. Time Warner Cable (TWX) saw its largest increase in video subscribers in six years. But earnings missed Street expectations, and TWC dropped 1.5%.
Also in earnings, shares of LinkedIn (LNKD) plunged 27% in extended trading on a weak corporate earnings outlook. The leading online professional network said it expects adjusted per-share earnings of 28 cents on sales of $670 million to $675 million for the current quarter, which ends June 30.
As for the international realm, shares fell in Asia on Thursday following the U.S. economic news, and Japan also reported that its industrial output fell 0.3% in March from the month before and 1.2% from the previous year.
All of our 10 ETFs in the Spotlight again slipped and closed in the red. Leading the group to the downside was this year’s winner, healthcare (XLV), with a loss of 1.40%, while consumer staples (XLP) held up best by giving back only 0.33%.
2. ETFs in the Spotlight
In case you missed the announcement and description of this section, you can read it here again.
It features 10 broadly diversified ETFs from my HighVolume list as posted every Monday. Furthermore, they are screened for the lowest MaxDD% number meaning they have been showing better resistance to temporary sell offs than all others over the past year.
Here are the 10 candidates:
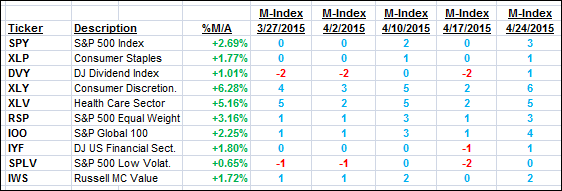
The above table simply demonstrates the magnitude with which some of the ETFs are fluctuating in regards to their positions above or below their respective individual trend lines (%M/A). A break below, represented by a negative number, shows weakness, while a break above, represented by a positive percentage, shows strength.
For hundreds of ETF/Mutual fund choices, be sure to reference Thursday’s StatSheet.
Year to date, here’s how the above candidates have fared so far:
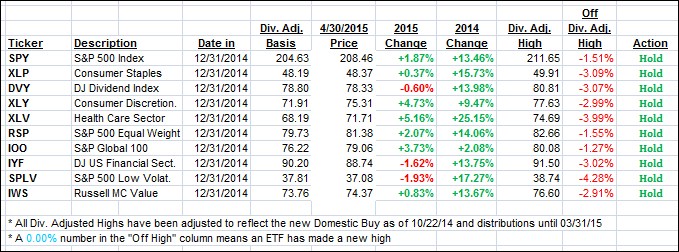
Again, the first table above shows the position of the various ETFs in relation to their respective long term trend lines (%M/A), while the second one tracks their trailing sell stops in the “Off High” column. The “Action” column will signal a “Sell” once the -7.5% point has been taken out in the “Off High” column.
3. Trend Tracking Indexes (TTIs)
Our Trend Tracking Indexes (TTIs) weakened but remain bullish, while none of the trailing sell stops were triggered.
Here’s how we ended this red day:
Domestic TTI: +2.29% (last close +2.96%)—Buy signal effective 10/22/2014
International TTI: +4.34% (last close +4.97%)—Buy signal effective 2/13/2015
Disclosure: I am obliged to inform you that I, as well as advisory clients of mine, own some of these listed ETFs. Furthermore, they do not represent a specific investment recommendation for you, they merely show which ETFs from the universe I track are falling within the guidelines specified.
Contact Ulli