
1. Moving the Markets
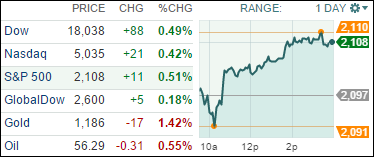
Equities rose as the major indexes moved closer to record levels, and a tech stock rally sent the Nasdaq to a new 2015 closing high.
In earnings news, Dow giants McDonald’s (MCD) and Coca-Cola (KO) helped boost the blue-chip index higher as shares of MCD jumped 3.1% and KO rose 1.3% on the companies’ earnings reports. Facebook (FB) disappointed investors by reporting first-quarter revenues that were less than expected, sending shares down more than 2% in after-hours trading. On the flip side, Boeing (BA) flew past analyst estimates in the Q1 with earnings per share of $1.97.
First-quarter earnings season will likely set much of the tone for the rest of the week. In addition, existing home sales will be reported on Wednesday after markets close, new home sales are expected Thursday, and durable goods orders are expected on Friday.
In the economic realm, excluding the often volatile auto and gas categories, retail sales posted a 0.5% increase in March, slightly below economists’ expectations. The pace of growth in consumer spending has slowed from the strong levels at the end of 2014, but remains positive nonetheless. Inflation data showed some signs of a pickup, with both the PPI and CPI indexes posting larger-than-expected increases. Despite the slight uptick though, inflation remains relatively low overall.
All our 10 ETFs in the Spotlight climbed higher with lead by IYF (Financials) with a gain of 0.85%, while the laggard turned out to be XLP (consumer staples), which edged up by 0.06%.
2. ETFs in the Spotlight
In case you missed the announcement and description of this section, you can read it here again.
It features 10 broadly diversified ETFs from my HighVolume list as posted every Monday. Furthermore, they are screened for the lowest MaxDD% number meaning they have been showing better resistance to temporary sell offs than all others over the past year.
Here are the 10 candidates:
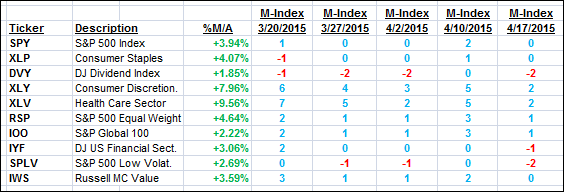
The above table simply demonstrates the magnitude with which some of the ETFs are fluctuating in regards to their positions above or below their respective individual trend lines (%M/A). A break below, represented by a negative number, shows weakness, while a break above, represented by a positive percentage, shows strength.
For hundreds of ETF/Mutual fund choices, be sure to reference Thursday’s StatSheet.
Year to date, here’s how the above candidates have fared so far:
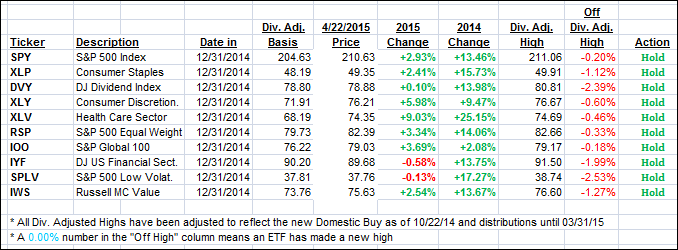
Again, the first table above shows the position of the various ETFs in relation to their respective long term trend lines (%M/A), while the second one tracks their trailing sell stops in the “Off High” column. The “Action” column will signal a “Sell” once the -7.5% point has been taken out in the “Off High” column.
3. Trend Tracking Indexes (TTIs)
Our Trend Tracking Indexes (TTIs) moved up and closed deeper on the bullish side of their respective trend lines.
Here’s how we ended this day:
Domestic TTI: +3.45% (last close +3.34%)—Buy signal effective 10/22/2014
International TTI: +5.00% (last close +4.81%)—Buy signal effective 2/13/2015
Disclosure: I am obliged to inform you that I, as well as advisory clients of mine, own some of these listed ETFs. Furthermore, they do not represent a specific investment recommendation for you, they merely show which ETFs from the universe I track are falling within the guidelines specified.
Contact Ulli