
ETF/No Load Fund Tracker Newsletter For April 3, 2015
ETF/No Load Fund Tracker StatSheet
————————————————————-
THE LINK TO OUR CURRENT ETF/MUTUAL FUND STATSHEET IS:
————————————————————
Market Commentary
Friday, April 3, 2015
MARKETS BACK ON TOP TO CLOSE OUT THE WEEK
1. Moving the Markets
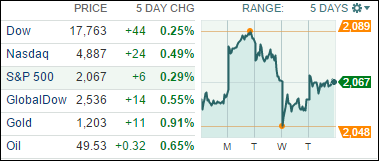
U.S. indexes closed higher after a reading on the labor market came in better than expected. That report raised hopes that Friday’s payroll numbers may also show similar strength for the month of March.
For the week, stocks finished the holiday-shortened week flat. Economic numbers were generally weaker than expected and daily market fluctuations were relatively small overall, with the S&P 500 finishing up 0.5% on the week. Stocks have remained in a relatively narrow range in recent weeks, but normal market volatility could certainly return as we enter Q1 earnings season.
For you oil lovers, we heard today that economic sanctions are limiting oil-rich Iran from exporting crude. News that the U.S. is pushing harder on Iran to limit its nuclear program didn’t bode well for oil investors it seems. Benchmark West Texas Intermediate crude fell 1.2% to $49.47 a barrel, while Brent crude tumbled 3.4% to $55.18.
In the week ahead, the ISM Non-manufacturing Index will be released on Monday, the meeting minutes from the Federal Reserve’s March meeting will be released on Wednesday, and weekly jobless claims will be reported on Thursday.
All of our 10 ETFs in the Spotlight moved higher led by Consumer Discretionaries (XLY) with +0.89%, while Select Dividends (DVY) lagged with a gain of +0.19%.
2. ETFs in the Spotlight
In case you missed the announcement and description of this section, you can read it here again.
It features 10 broadly diversified ETFs from my HighVolume list as posted every Monday. Furthermore, they are screened for the lowest MaxDD% number meaning they have been showing better resistance to temporary sell offs than all others over the past year.
Here are the 10 candidates:
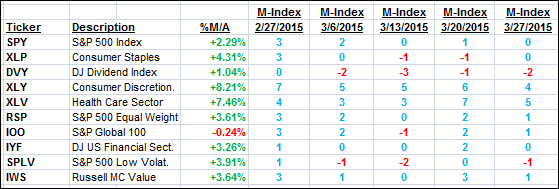
The above table simply demonstrates the magnitude with which some of the ETFs are fluctuating in regards to their positions above or below their respective individual trend lines (%M/A). A break below, represented by a negative number, shows weakness, while a break above, represented by a positive percentage, shows strength.
For hundreds of ETF/Mutual fund choices, be sure to reference Thursday’s StatSheet.
Year to date, here’s how the above candidates have fared so far:
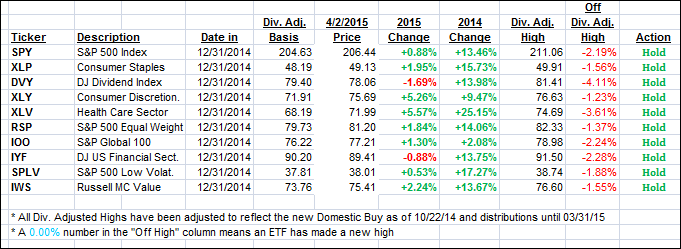
Again, the first table above shows the position of the various ETFs in relation to their respective long term trend lines (%M/A), while the second one tracks their trailing sell stops in the “Off High” column. The “Action” column will signal a “Sell” once the -7.5% point has been taken out in the “Off High” column.
3. Trend Tracking Indexes (TTIs)
Our Trend Tracking Indexes (TTIs) were mixed with the Domestic one slipping and the International one gaining.
Here’s how we ended this roller-coaster week:
Domestic TTI: +2.74% (last Friday +2.90%)—Buy signal effective 10/22/2014
International TTI: +3.83% (last Friday +3.47%)—Buy signal effective 2/13/2015
Have a nice weekend.
Ulli…
Disclosure: I am obliged to inform you that I, as well as advisory clients of mine, own some of these listed ETFs. Furthermore, they do not represent a specific investment recommendation for you, they merely show which ETFs from the universe I track are falling within the guidelines specified.
————————————————————-
READER Q & A FOR THE WEEK
All Reader Q & A’s are listed at our web site!
Check it out at:
http://www.successful-investment.com/q&a.php
Reader Chris:
Q: Ulli: Do you ever decide to “take profits” on one of your 10 ETFs in apparent bubble conditions or instead wait and let the TTI’s help decide what to do?
For example, the biotech sector has been skyrocketing the past couple of years e.g. IBB ETF. The healthcare XLV ETF is considered a somewhat low beta ETF, but with that said, does have a decent % of biotech companies in its portfolio holdings.
I’m not sure on the exact %, but a few websites average to somewhere around 15-20% allocated to biotech companies in the XLV, which might provide a lot of volatility for this ETF if something were to disrupt the biotech industry e.g. Obamacare repeal, new gov. regulations etc.
A: Chris: I don’t like to make wild guesses about the direction of any ETFs I own; I like to use clearly defined price points to make my decisions for me. Most of the time, a trailing sell stop will be triggered before a trend line crossing occurs. When some ETFs rally strongly, such as biotechs and others, their respective trailing sell stops serve 2 purposes:
- To limit downside risk should a sell off occur shortly after a purchase has been made, and
- To lock in profits once an ETF has shot into the stratosphere and is bound to correct more quickly than others
It does not matter what the reasons for a sell-off are, I simply prefer having the sell stops be my guide as to whether to exit or not, rather than me trying to make an educated guess. Remember, one of the reasons we engage in Trend Tracking is to take the emotions out of the equation and become less attached to the decision making process.
———————————————————-
WOULD YOU LIKE TO HAVE YOUR INVESTMENTS PROFESSIONALLY MANAGED?
Do you have the time to follow our investment plans yourself? If you are a busy professional who would like to have his portfolio managed using our methodology, please contact me directly or get more details at:
https://theetfbully.com/personal-investment-management/
———————————————————
Back issues of the ETF/No Load Fund Tracker are available on the web at:
https://theetfbully.com/newsletter-archives/
Contact Ulli