
1. Moving the Markets
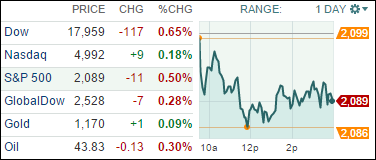
Markets were all peachy yesterday upon the Fed’s sentiment of keeping interest rates low for the near future. However, today was a new day and, as you know, market sentiment can change on a dime daily. Of the three major indexes, only the Nasdaq composite gained slightly.
Oil seemed to be the major driver pushing index prices lower. In oil, the benchmark index slid today to close at $43.96 a barrel, which extended the previous week’s decline. Amongst the biggest losers were Chevron (CVX) and Exxon Mobil (XOM). The general sentiment is that producers have not been eager to cut production, regardless of dropping prices over the past six months and prices will remain low until they intend to do so.
Big tech news of late is that Apple (AAPL) replaced AT&T as a Dow component. The move to the new index will take some time for settling in, so don’t fret that on its first day of trading in its new home did not result in major gains. The stock fell 0.8% on the day, but overall investors remain bullish that the company will continue pushing to record highs.
All of our 10 ETFs in the Spotlight headed south with yesterday’s winner, IOO, leading the decliners with a loss of -1.01%. Bucking the negative trend was healthcare (XLV), which managed to gain +0.58% in the face of adversity and made a new yearly high at the same time.
2. ETFs in the Spotlight
In case you missed the announcement and description of this section, you can read it here again.
It features 10 broadly diversified ETFs from my HighVolume list as posted every Monday. Furthermore, they are screened for the lowest MaxDD% number meaning they have been showing better resistance to temporary sell offs than all others over the past year.
Here are the 10 candidates:
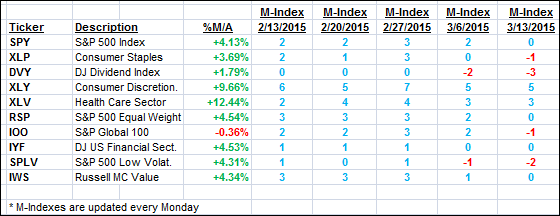
The above table simply demonstrates the magnitude with which some of the ETFs are fluctuating in regards to their positions above or below their respective individual trend lines (%M/A). A break below, represented by a negative number, shows weakness, while a break above, represented by a positive percentage, shows strength.
For hundreds of ETF/Mutual fund choices, be sure to reference Thursday’s StatSheet.
Year to date, here’s how the above candidates have fared so far:
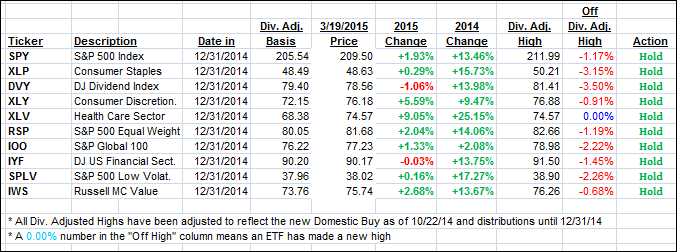
Again, the first table above shows the position of the various ETFs in relation to their respective long term trend lines (%M/A), while the second one tracks their trailing sell stops in the “Off High” column. The “Action” column will signal a “Sell” once the -7.5% point has been taken out in the “Off High” column.
3. Trend Tracking Indexes (TTIs)
Our Trend Tracking Indexes (TTIs) retreated as well but remain on the bullish side of their respective trend lines.
Here’s how we ended up:
Domestic TTI: +3.67% (last close +3.93%)—Buy signal effective 10/22/2014
International TTI: +3.83% (last close +4.37%)—Buy signal effective 2/13/2015
Disclosure: I am obliged to inform you that I, as well as advisory clients of mine, own some of these listed ETFs. Furthermore, they do not represent a specific investment recommendation for you, they merely show which ETFs from the universe I track are falling within the guidelines specified.
Contact Ulli