
1. Moving the Markets
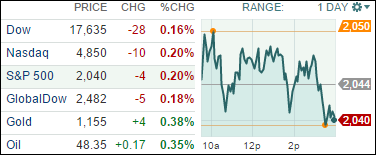
Markets experienced one of the largest sell-off in equities over the past two months. A rising dollar value and declines in tech companies stock seemed to be the major culprits today.
In tech Cisco Systems Inc. (CSCO) took a hit for the sixth time in seven days, suffering its largest daily decline since 2013. Apple (AAPL) also fell today, despite the bullish news on its smart-watch of late.
How did the dollar impact markets today? Well, the currency’s climb to a 12-year high versus the euro is concerning investors that earnings may be somewhat inflated and could thus take a major hit of the dollar weakens.
An interesting piece of news that came in today was that pet retail giant PetSmart (PETM) announced it has been taken private by a group of investors called BC Partners. The acquisition was priced at $8.7 billion. Apparently, the President and CEO are stepping down as part of the deal. The company’s shares rose 4 cents to $82.99 in afternoon trading. The stock will be delisted after the close of trading Wednesday.
2 of our 10 ETFs in the Spotlight managed to eke out a gain on this slippery day. The biggest loser was consumer staples (XLP), which skidded -0.77%. 2 ETFs remain green YTD as you can see in table 2.
2. ETFs in the Spotlight
In case you missed the announcement and description of this section, you can read it here again.
It features 10 broadly diversified ETFs from my HighVolume list as posted every Monday. Furthermore, they are screened for the lowest MaxDD% number meaning they have been showing better resistance to temporary sell offs than all others over the past year.
Here are the 10 candidates:
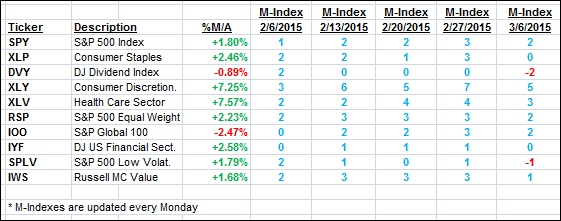
The above table simply demonstrates the magnitude with which some of the ETFs are fluctuating in regards to their positions above or below their respective individual trend lines (%M/A). A break below, represented by a negative number, shows weakness, while a break above, represented by a positive percentage, shows strength.
For hundreds of ETF/Mutual fund choices, be sure to reference Thursday’s StatSheet.
Year to date, here’s how the above candidates have fared so far:
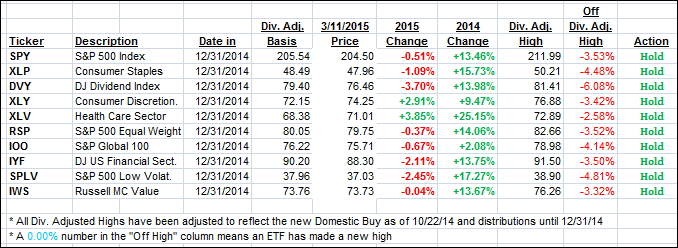
Again, the first table above shows the position of the various ETFs in relation to their respective long term trend lines (%M/A), while the second one tracks their trailing sell stops in the “Off High” column. The “Action” column will signal a “Sell” once the -7.5% point has been taken out in the “Off High” column.
3. Trend Tracking Indexes (TTIs)
Our Trend Tracking Indexes (TTIs) showed a mixed picture with the domestic one slipping a tad while the international one gained slightly.
Here’s how we closed on this red day:
Domestic TTI: +2.24% (last close +2.30%)—Buy signal effective 10/22/2014
International TTI: +1.60% (last close +1.51%)—Buy signal effective 2/13/2015
Disclosure: I am obliged to inform you that I, as well as advisory clients of mine, own some of these listed ETFs. Furthermore, they do not represent a specific investment recommendation for you, they merely show which ETFs from the universe I track are falling within the guidelines specified.
Contact Ulli