
1. Moving the Markets
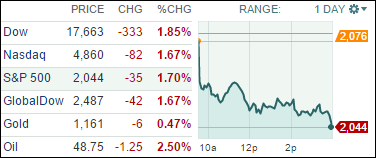
Pricing in a potential rate hike by the Fed came home to roost as the Dow suffered its worst one-day point drop in some five months. Despite some central banks starting a quantitative easing path, such as the ECB, there was simply no support, and the major indexes went negative YTD.
Europe’s QE launch made the dollar stronger, and we might move to parity with the Euro currency. If in fact the Fed raises rates later on this year, we will be at odds with the rest of the world where lower interest rates and consequently weaker currencies are supposed to spark some growth by making exports more competitive.
This pullback reminds me of what we saw in October last year, and I am wondering if the usual assist to drive markets higher again, might be on the horizon. That assist came in form of one of the Fed’s mouthpieces jawboning about lower rates are here to stay and/or the reinstatement of QE4. Nothing would surprise me, but only time will tell if this kind of rescue effort will materialize.
To no surprise, all of our 10 ETFs in the Spotlight headed south, as there was simply no place to hide today. Leading the pack down were the financials (IYF) at -1.90%, while healthcare (XLV) showed the most resistance at -1.11%. Only 2 ETFs remain on the plus side YTD.
Our Trend Tracking Indexes (TTIs) retreated as well but remain on the bullish side of their respective trend lines (see table 3).
2. ETFs in the Spotlight
In case you missed the announcement and description of this section, you can read it here again.
It features 10 broadly diversified ETFs from my HighVolume list as posted every Monday. Furthermore, they are screened for the lowest MaxDD% number meaning they have been showing better resistance to temporary sell offs than all others over the past year.
Here are the 10 candidates:
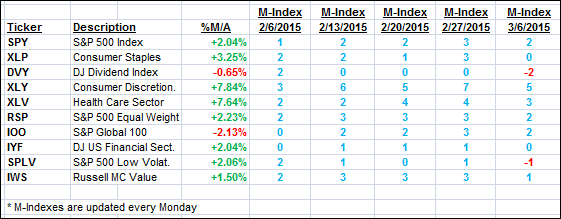
The above table simply demonstrates the magnitude with which some of the ETFs are fluctuating in regards to their positions above or below their respective individual trend lines (%M/A). A break below, represented by a negative number, shows weakness, while a break above, represented by a positive percentage, shows strength.
For hundreds of ETF/Mutual fund choices, be sure to reference Thursday’s StatSheet.
Year to date, here’s how the above candidates have fared so far:
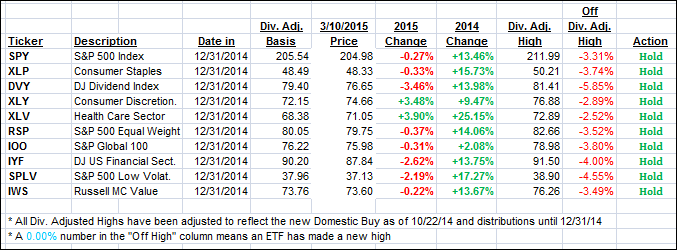
Again, the first table above shows the position of the various ETFs in relation to their respective long term trend lines (%M/A), while the second one tracks their trailing sell stops in the “Off High” column. The “Action” column will signal a “Sell” once the -7.5% point has been taken out in the “Off High” column.
3. Trend Tracking Indexes (TTIs)
Our Trend Tracking Indexes (TTIs) both headed south with the International one showing a larger drop.
Here’s how we closed on this red day:
Domestic TTI: +2.30% (last close +3.03%)—Buy signal effective 10/22/2014
International TTI: +1.51% (last close +2.91%)—Buy signal effective 2/13/2015
Disclosure: I am obliged to inform you that I, as well as advisory clients of mine, own some of these listed ETFs. Furthermore, they do not represent a specific investment recommendation for you, they merely show which ETFs from the universe I track are falling within the guidelines specified.
Contact Ulli